Version française : 
Introduction
PC-RM4 is a workshop chronocomparator intended for setting mechanical watches.
The functions proposed by PC-RM4 are as follows:
- Selection of the number of beats per hour.
- Possibility of setting a number of non-standard beats.
- Launching, pause, resume or reset the measurement.
- Measurement and display of the difference between the measured period of the watch and the expected period.
- Measuring and displaying the difference between the duration of a Tick and the duration of a Tock.
- Measurement and display of the number of the gains or loses per day.
- Measuring and displaying the time difference between the duration of a Tick and the duration of a Tock.
- Graphic display of the signal with calculation of the amplitude and possibility of adjusting the lift angle.
- Selection of functions by touch screen.
- Simulation mode to familiarize yourself with the timng machine without using a real watch.
Its accuracy is of the order of 25ns (it depends on the frequency chosen for the time base, the frequency used here is 40MHz) which allows a precision over 24 hours of the order of 0.02s at the precision of the time base close (around 0.01%).
If you pratice electronics as an hobby, its production cost is around fifty euros, mainly due to the processor board (DevEBox) and the 320x280 pixel LCD screen. You can also use the printed circuit(PCB) that I developed.
RELATED INFORMATION
Timing machine PC-RM1
Sensor for timing machine (in French)
USER MANUAL
Disclaimer: Some screenshots were taken with the 3.2" screen, 320x240 definition, others with the 3.5" screen, 480x320 definition. Obviously, the latter are prettier but do not be impressed. The 320x240 version looks much better in reality than in the photos.
Also, the texts are mainly in French but the language can be changed.
Hardware
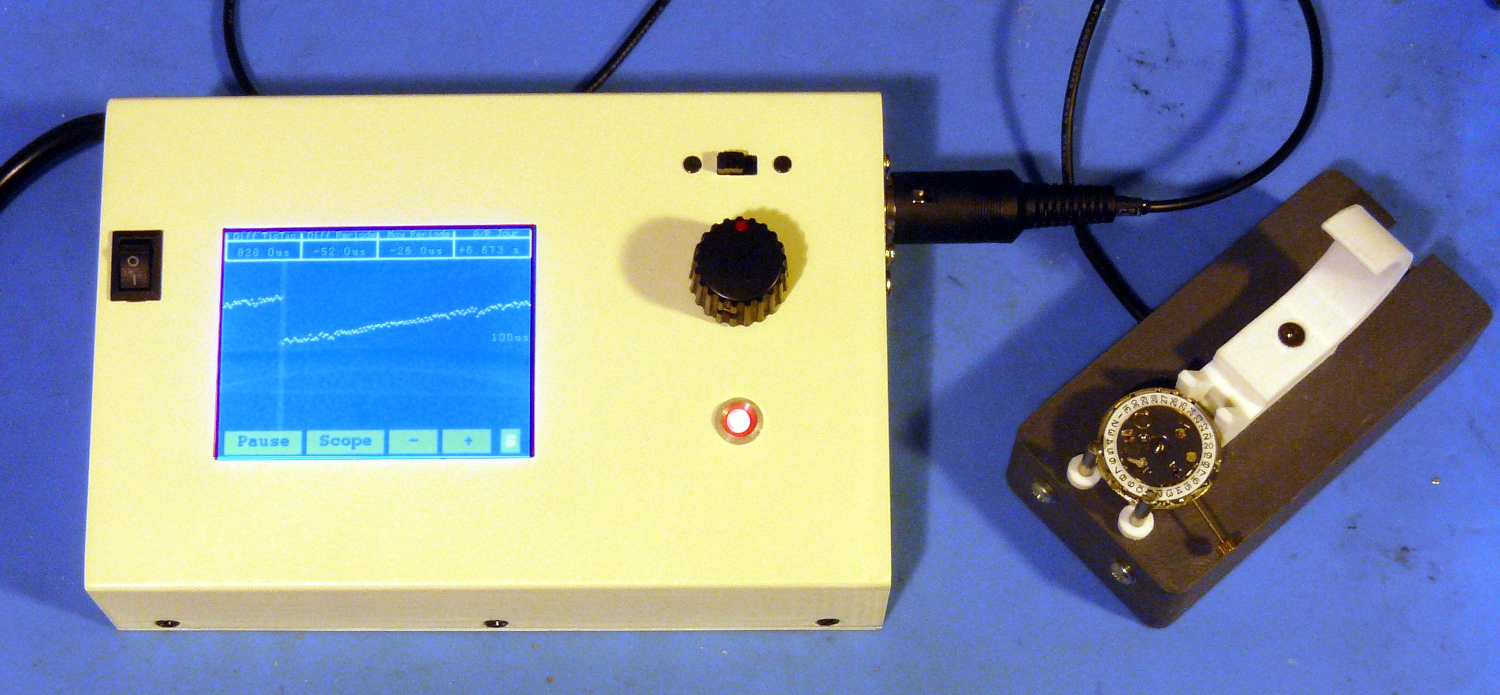
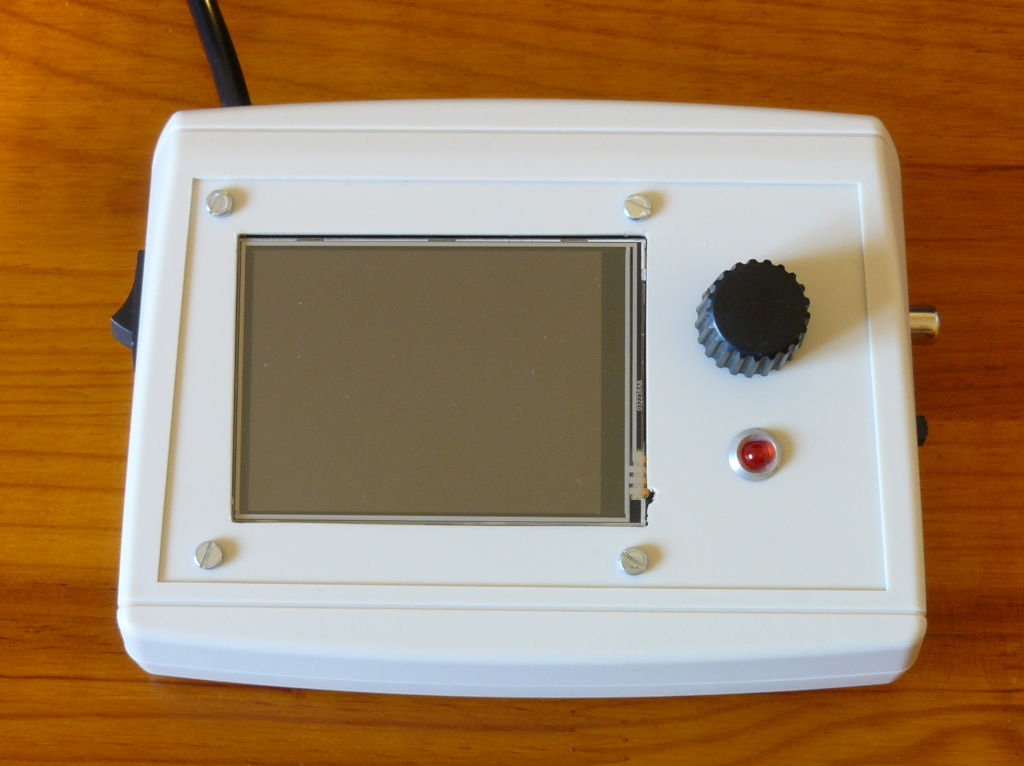
From an external point of view, the chronocomparator looks like this :
- Graphic display screen with touchScreen. The program can handle 320x240 pixel or 480x320 pixel screens.
- Input for connecting the sensor (jack). You will find an example of a sensor on the page dedicated to PC-RM1 or better, on the one dedicated to PC-RM2.
- Output (optional) allowing the amplified analog signal to be connected to another device (for example, an oscilloscope).
- Input (optional) for injecting a signal generated by a watch that is already amplified by another device. In this case, a switch must be added to select the input for a non-amplified sensor from that for an amplified sensor.
- Potentiometer for adjusting the gain of the amplification of the signal received from the sensor.
- LED which flashes according to the beats of the watch when the gain of the amplification is correctly adjusted.
- Power cord with earth plug for powering the whole.
- On-Off switch.
When you connect a sensor to the Jack socket (switch in the "non-amplified signal" position), the chronocomparator amplifies the signal received (which generally comes from a piezo sensor) so as to be able to perform the measurements
The LED flashes according to the beats received. If it does not flash, it means that the amplification is insufficient (or that the sensor is not generating signals). If it flashes erratically, the amplification is too high. If it flashes regularly, the amplification is set correctly.
The gain of the amplification is adjusted by acting on the potentiometer.
Main features
The main features are:
- Beats selection.
- Operating mode: real measurement mode (a real watch) or simulated measurement mode (an internal generator simulates the operation of a watch).
- Measurement of time parameters of the watch.
- Scope function (signal display in analog form) with amplitude measurement.
- Settings (watch lift angle, language, non standard beats,etc.).
- Touchscreen Calibration.
These different functionalities are detailed below.
Ergonomic aspects
The different functionalities are offered through displays and inputs by touch buttons that have common characteristics:
- Unselected buttons usually have a green, white, or yellow background.
- Selected buttons usually have a red background.
- Inactive buttons have a gray background.
- When this is useful, the acknowledgment of the pressing of a button is signaled by rapid flashing of the button.
- All screens (except Home and TouchScreen setting) have a timer synchronization indicator:
- When it is green, it means that the timer is synchronized on a valid signal.
- When it is orange, it means that the timing machine is synchronized on a valid signal but that from time to time, a Tick or Tock signal is lost.
- When it is red or flashing rapidly, the timer is not synchronized with a signal (absence of signal or signal having an incorrect shape).
- In simulation mode (see "Selecting a beat"), the device is always synchronized.
Calibration TouchScreen
When first powered on, the device displays a touchScreen calibration screen. You exit this screen when the calibration is successful.
To calibrate the touchScreen, press the stylus on the crosses that are displayed. If the calibration is successful, you go directly to the home screen. Otherwise, the program asks for a calibration again.
Calibration data is stored in battery powered memory. If the battery is out of service, this data is not stored after the timing machine has been switched off. Its lifespan is several years.
Once the calibration of the TouchScreen has been done, the following power-ups no longer propose this calibration screen.
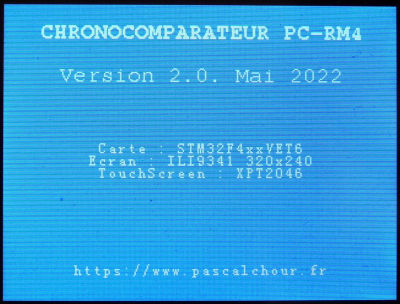
Homepage
It is displayed for about 2 seconds. If this screen is pressed twice with the stylus during its display, the following screen will be that of the touchScreen calibration. Otherwise, we go to the beat selection screen.
The welcome screen displays:
- the version of the program and its date (example: Version 2.2 07/2022).
- The processor used and the development board (Example: STM32_F4VE, DevEBox).
- The screen controller and its definition (Example: ILI9341 320x240).
- The Touchscreen controller (Example: ADS7846).
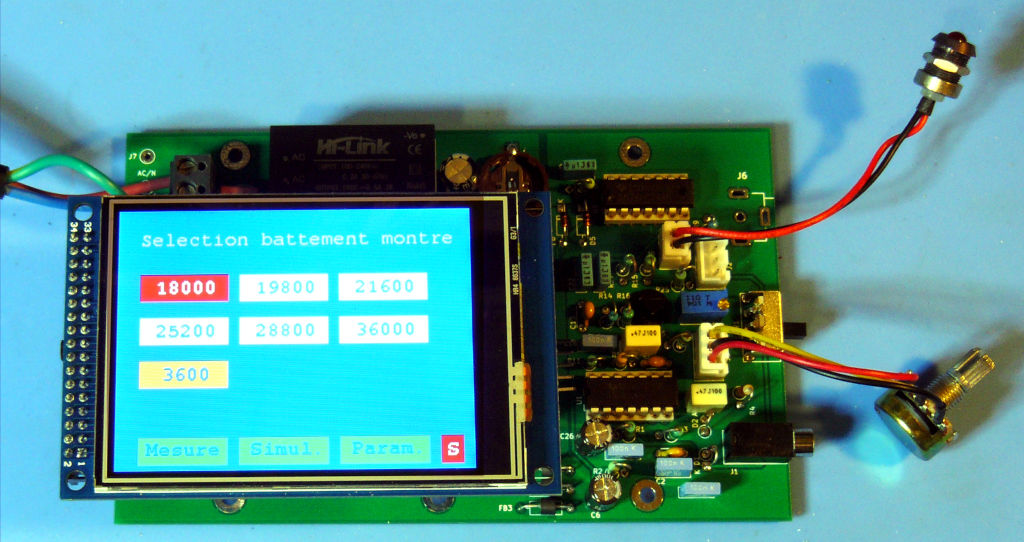
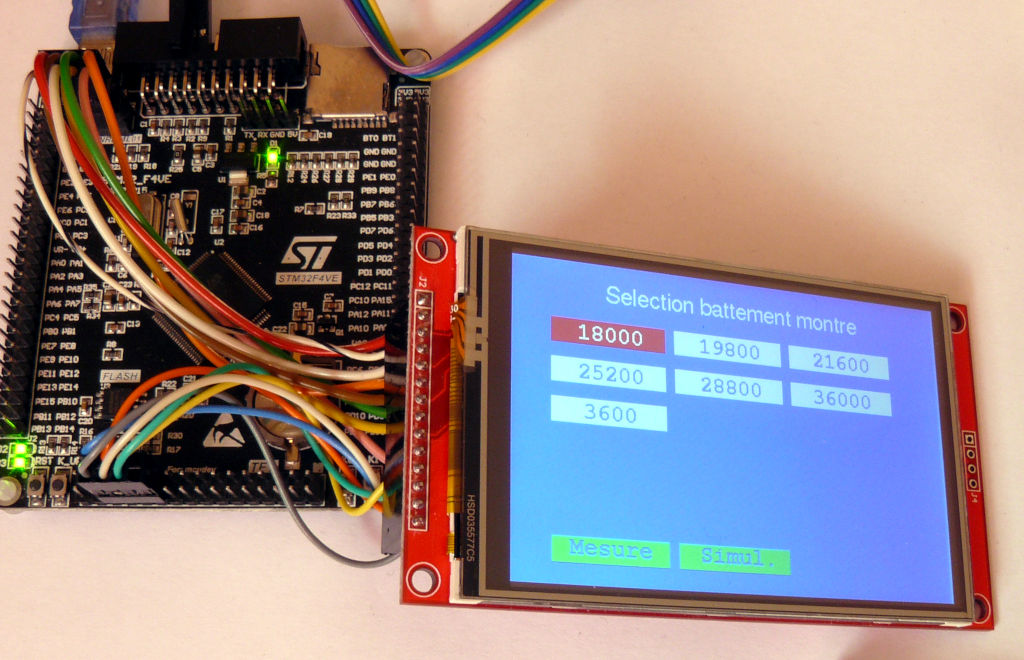
Beat selection
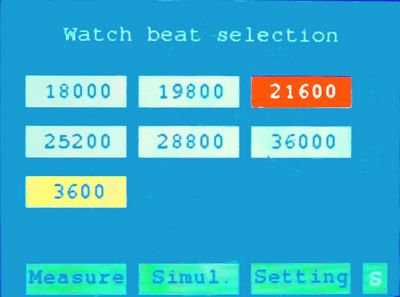
This screen displays buttons indicating the possible beats for the watch to be set. The value selected by default is indicated by a button with a red background (that of the previous choice or the first value available if it is the first power-up). It also gives access to the screen for measuring the time parameters of the watch ("Measurement") and to a screen for setting the timing machine ("Param.").
To choose a beat, simply press one of the buttons displayed. Acknowledgment of the press is indicated by the button flashing (red-white) which then remains red.
Note that the last proposed beat can be configured (see "Param." button and configuration screen). It is indicated on a yellow background when it is not selected.
The selected value is kept in saved memory.
The "Simulation" button allows the timing machine to operate with an internal signal simulator. The measurements are then carried out on the basis of this simulator. The option is disabled by default.
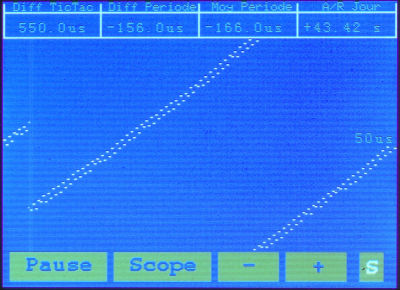
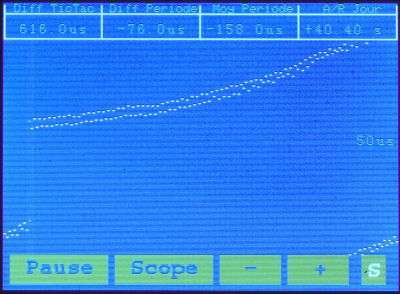
Watch Time Parameters Measurement Screen
This screen displays:
- DiffTicTac: The difference in duration between a Tick and a Tock with the most suitable unit of measurement (microsecond, millisecond, second, *** if overflow.
- Diff. Period: The average of the difference between the duration of the beats measured and those expected with the most suitable unit of measurement (microsecond, millisecond, second, *** if overflow. This average is calculated over a duration of 4 seconds.
- Avg. Period: The average of the difference between the duration of the beats measured and those expected with the most suitable unit of measurement (microsecond, millisecond, second, *** if overflow. This average is calculated from the start of the measurement (or since the last measurement reset).
- F/S Day: the gains or loses per day.
- Note that the smallest value displayed is 1µs, whether in values or in the graph. On the other hand, the calculations are all done in multiples of the clock period which is 23ns (nanosecond) for a frequency of 42MHz.
A nanosecond display for a mechanical watch didn't seem very useful. For a watch that beats at 18,000 beats per hour, a deviation of 1µs over a half period represents less than a second of shift per day. But if someone insists, I can adapt the display to count in 1/10 of a microsecond.
Similarly, the graphic display of the rate of the watch is limited to a lag of 1 ms per half-period with respect to the normal rate. It is recalled that for a watch which beats 18,000 strokes per hour, a shift of one millisecond per half-period represents a daily difference of nearly 15 minutes. There is probably something else to do before thinking about adjusting the precision of the watch. - The variation of the watch (Marche de la montre, Running of the watch). This is the graphic part of the measurement which takes up the principle of the remarkable Vibrograf, which is also used by all the chronocomparators I know and to which watchmakers are accustomed .
 For each Tick or Tock, a dot or dash is displayed relative to the previous one. If it arrives earlier than expected, the new point will be placed higher than the previous one. If it arrives later than expected, it will be placed lower.
After a few measurements, we therefore have the outline of a line which gives a first indication of the rate of the watch.
Also, it is common for there to be a slight difference between the duration of a Tick and a Tock. It should be noted that this difference does not necessarily have an impact on the advance or the delay, the greater duration of a Tick being able to be compensated by the lesser duration of a Tock (or the reverse). On the other hand, on the graph, this will result in two parallel lines if there is a difference in duration.
We therefore have a representation which on the same graph gives the general rate of the watch (orientation of the plot) and the possible differences between a Tick and a Tock that we must minimize.
To summarize:- A single almost horizontal line indicates that the watch has neither delay nor advance and that the duration of a Tick and a Tock are identical. This is the ideal case.
- Two almost horizontal lines indicate that the watch has neither delay nor advance but that the duration of a Tick and a Tock are slightly different.
- The same reasoning applies if the lines are oblique except that the downward or upward orientation indicates that the watch is advancing or retarding.
- If there are irregularities between the Ticks and Tocks that result in points that periodically go out of normal running (oblique or straight), it means that there is a mechanical problem, probably on the escapement side.
The available commands are:
- A button to pause the measurement. When the measurement is paused, other buttons are displayed (return to beat screen, resume measurement, reset measurement (all previously measured data is lost)).
- A button "Scope" on a green background which allows access to the "scope" function (graphic display of the signal).
- Buttons "+" and "-" which could be described as "zoom" allow to increase or decrease the precision of the trace (running of the watch). If the precision of the trace is high (1µs for example) and the beat offset is large, the measurements will go out of the display area. Zooming reduces this precision in order to have a display that fits in the plotting area. Conversely, too low a display precision (for example, 1 ms) for a low lag in the beat of the watch runs the risk of not revealing the faults of the watch.
The current zoom value is saved in non-volatile memory and is therefore restored after each power-up. It is displayed in the middle right of the measurement screen in µs. 1µs means that each dot in height of the display area represents 1µs. 10µs means that each dot in height represents 10µs, etc. up to 1000µs. - A synchronization indicator "S" which is on a green background if the timer is synchronized on the received signal or on a red background if it is out of sync. The chronocomparator is desynchronized when the duration of a Tick or a Tock exceeds 1.5 times the expected value. It then goes into a state where it attempts to resynchronize. It can also turn orange when the timer is synchronized but some Ticks or Tocks are lost.
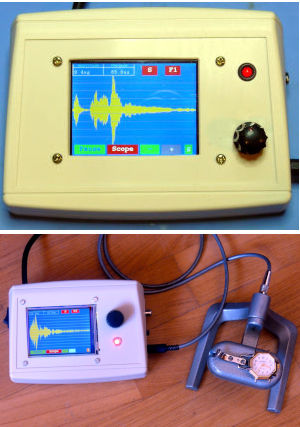
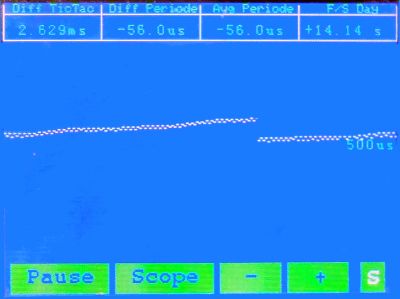
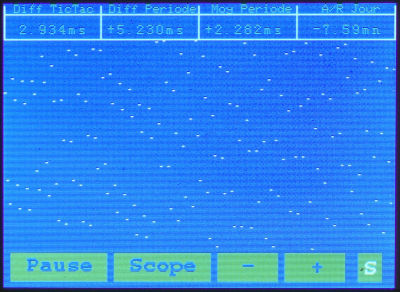
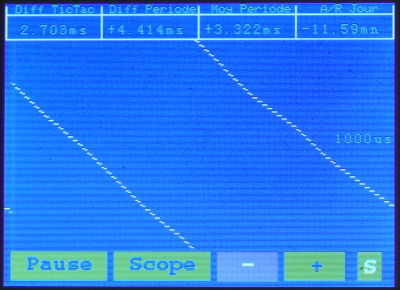
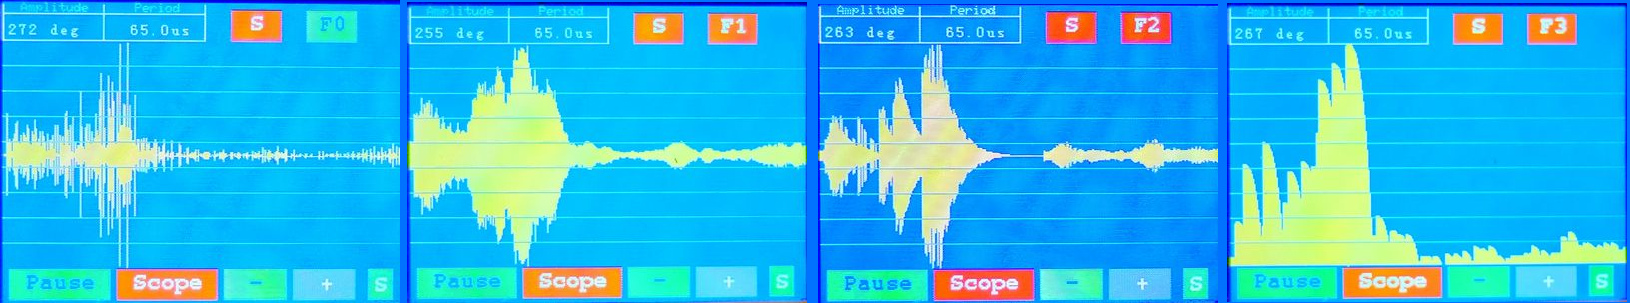
Some views of measurements. The first set of 3 photos are from a Lorsa 237B movement which needs a serious overhaul. The first photo represents the measurement while the movement is horizontal. The curve is characteristic of insufficient amplitude. During the second measurement, the movement is vertical and the time differences between Tick and Tock become too great for the display to be readable. You have to go to a resolution of 1000µs for it to be interpretable again (3rd photo). For information, the amplitude is 150°!.
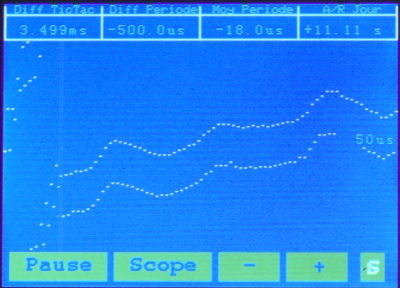
The following series of two photos come from a new Chinese 2813 movement (automatic and date) which cost around €15 in 2019. For the first photo, the movement is horizontal. There is a small periodic irregularity which should be able to be resolved by simple cleaning in the best case. For the second photo, the movement is vertical. Accuracy improves slightly but we find the defect mentioned above. For information, the amplitude is 272°.
Synchronization indicator
A synchronization indicator comprising the letter "S" is present at the bottom right of the time measurement screen. This indicator is colored green if the device is synchronized with the watch, orange if it synchronized but occasionally loses signals, or red when not synchronized. Synchronization takes place as follows:
- The device searches for an absence of signal for a duration which depends on the selected beat and which is between 1/4 and half of a half period.
- When it has found one, it waits for the first rising edge which normally corresponds to the "release" phase of the escapement (see this page (in French) if you don't know what it is). From this moment, the device considers itself synchronized.
- It considers itself out of sync if no signal appears after 1.5 times the half-period of a beat.
Scope function
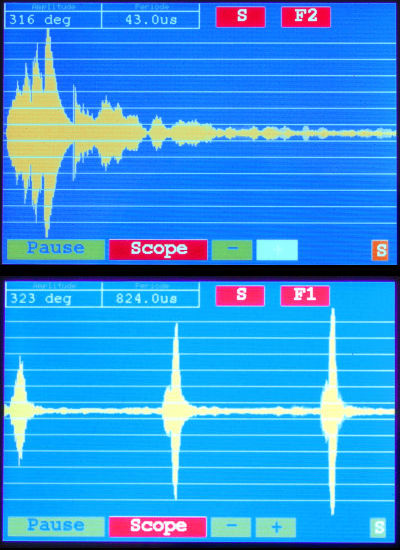
This screen displays:
- The amplitude (in degrees) of the pendulum and the difference between T1 and T3 (first peak and third pulse peak of a Tick or Tock). The lift angle for the amplitude calculation is by default 51° (the most common case). It can be configured (see configuration screen). As a reminder, the amplitude is calculated as follows: Amplitude = (3600 * AngleOfLifting)/(T*Π*n) or T =T1-T3 expressed in seconds, Π is the number Pi and n is the number of beats per hour.
The program also displays the sample period of the signal which is of some importance for interpreting the results. More details here. - The trace of the watch signal. On the abscissa, the time, on the ordinate, the voltage generated by the amplifier of the chronocomparator which comes from the measurement sensor of the watch.
- A button to pause the measurement. When the measurement is paused, other buttons are displayed (return to beat screen, resume measurement, reset measurement (all previously measured data is lost)).
- A button "Scope" on a red background allowing you to return to the screen for measuring the time parameters of the watch.
- Zoom buttons ("+" and "-") which allow to zoom the signal. Pressing "+" increases the width of the pulses of each Tick Tock and therefore decreases the number of Tick Tocks displayed. Conversely, pressing "-" decreases the width of the pulses of each Tick and Tock but allows to have more on the screen.
The current zoom value is saved in non-volatile memory and is therefore restored after each power-up. - A "S" synchronization indicator at the bottom of the screen. It is green if the timer is synchronized, red otherwise. Possibly in orange to indicate that Ticks and Tocks are lost.
- At the top of the screen, a button "S". By default, it is red (active). This indicates that the displays are triggered on a rising edge (T1) of the signal from the watch. If the chronocomparator is not synchronized, there cannot be any triggering and there is therefore no display (or then, very sporadically).
If you want to force the displays (to see what is happening...), you can press this button which then turns green (inactive). In this case, the chronocomparator permanently displays what it acquires. - At the top of the screen is a button labeled "F0". By default, it is green (inactive).
When it is inactive, the signal displayed is that acquired without reprocessing. If you press the button, it turns red (active) and indicates by a number ("F1", "F2"...) the applied filter:- "F0": Minimal filter. The signal displayed is with minimal adjustments. The button is green.
- "F1": Sliding average.
- "F2": Sliding average and attenuation according to an inverse exponential.
- "F3": folding and parabolic attenuation. The descending signals are attenuated according to a parabolic function which reduces the sudden differences between two signals.
Note on amplitude
The calculation of the amplitude is done by measuring the time between the first and the third pulse of a Tic or a Tac considering that there is a second pulse between the two (see Scope for more details).
The first pulse detected by the timer determines T1
T3 is the edge that corresponds to the highest amplitude in the measurement window (normally, T2 has a lower amplitude than T3).
The amplitude is calculated on a sliding average of successive measurements for the lift angle indicated in the configuration screen. This amplitude is very sensitive to weak shifts of T3-T1. To illustrate this point, here is a small numerical example:
The formula for calculating the amplitude is: Amplitude = (3600 * LeftAngle)/(T*Π*n) or T =|T1-T3| expressed in seconds, Π is the number Pi and n is the number of beats per hour. For this example, it is assumed that the watch beats 18,000 strokes per hour and that its angle of lift is 51°.
- A well-adjusted watch should have an amplitude of at least 270°. T3-T1 is in this case about 12ms.
- Assume a lag of 1ms. With 1ms less, the amplitude will be around 295°. With 1ms more, the amplitude will be around 249°
- 1ms may seem like a huge measurement error (it's around 8% of T3-T1 for 270°). If we now consider a measurement uncertainty of the order of 0.1%, we will have:
- For a lag of 120µs less, we will be around 273° and for 120µs more, around 267°.
With 120µs, we can already have doubts that the movement is in its best condition. In practice, if you observe the beat of many watches, you will find that the triggering of T3 can vary well beyond 120µs compared to the best T3-T1 with the consequence of an average amplitude which will tend to be pessimistic. You just have to keep this point in mind when interpreting the value displayed by the chronocomparator.
Note on synchronization
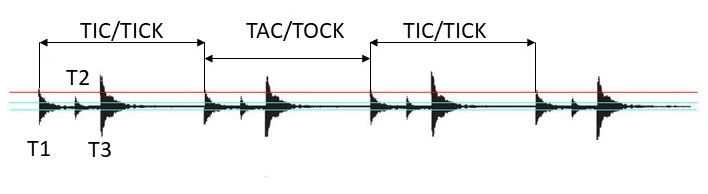
To perform its measurements, the timing machine needs to detect the first edges of the signals generated by the ticks or tocks. When this is the case, the device is correctly synchronized.
As seen in the figure above, the signal is made up of a line of very low amplitude (framed by the two lines in blue) and peaks at periodic intervals.
To detect the first edge, the triggering of the synchronization must be done for a value higher than the low amplitude line. If the trigger threshold is at a lower value, the device will not be able to synchronize.
The low amplitude line is a more or less random noise that is produced by any electronic element. External noise can be added to this internal noise. For example, LED lights or other electrical equipment can generate noise that will be picked up by the conductive elements that make up the device, for example, its power cable or the cable that connects the sensor to the timing machine.
If the noise is too high, it can drown out the useful signal. In this case, any synchronization is impossible. The cause must be found and eliminated (for example, sometimes it is enough to turn off an LED light that is too close).
The scope function visualizes this noise like the rest of the signal and makes it possible to detect anything abnormal.
To improve synchronization, the program introduces an occultation window whose principle is as follows:
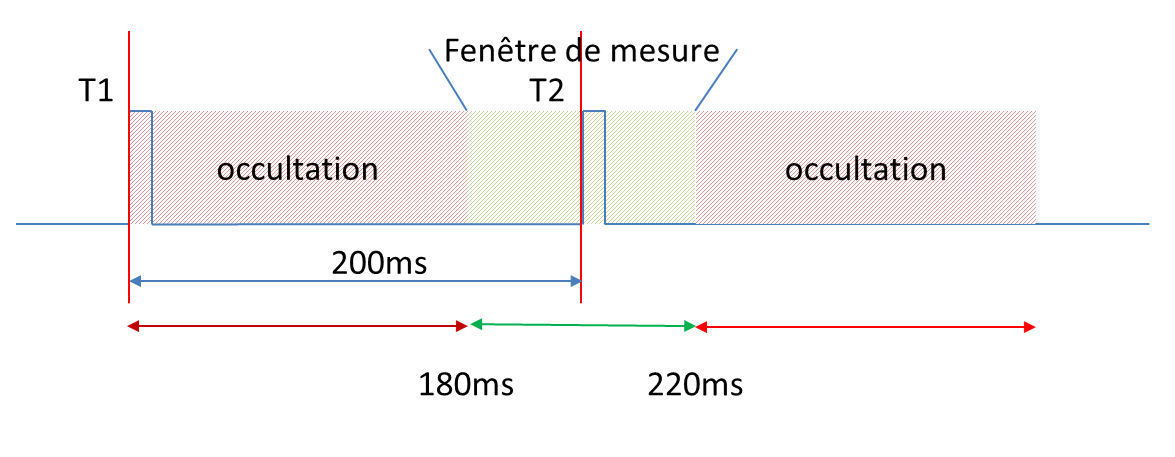
Suppose a certain Tic occurs at time T1. The next must occur at time T2 = T1 + duration of a half period.
The authorized measurement window is centered on T2. Pulses are only taken into account in the green zone. If a pulse occurs in the first zone shaded in red (before T2), it is ignored. If the pulse occurs beyond the green zone, it probably means that a signal has been lost. The chronocomparator ignores this data and tries to resynchronize itself on another pulse.
For a watch that beats at 18,000 beats per hour, the half-period (duration between a tick and a tock) is 200ms. If a blanking duration of 9/10 is chosen, the pulses will only be taken into account between T1+180ms and T1+220ms.
An occultation duration of 9/10 of the half-period makes it possible to eliminate parasitic phenomena.
Note on filters and sampling
The displayed signal comes from measurements that are made at regular time intervals, like on a digital oscilloscope. This means that certain phenomena may not appear if their duration is less than the sampling period.
Suppose the sampling is 50µs. This means that the device takes a measurement every 50µs. Between two measurements, any signals that may be present are simply not taken into account.
If a signal has a duration of more than 50µs, it will appear, sometimes as a single dash.
In a watch, it is unlikely that signals have a duration of less than 50µS. The orders of magnitude are rather of the order of a millisecond. However, this duration of 50µs varies according to the zoom used. If you want to view the signal over a long period (for example, 4 Tick or Tock), the signal displayed will represent a duration of 800ms for a watch that beats 18000 beats per hour. On a screen 360 pixels wide, each pixel will therefore represent 2ms what happens in the orders of magnitude of signals of short duration on a watch. There is therefore a greater risk of missing certain signals.
We could over-sample but at some point, it will be necessary to reduce all the measurements so that they can be displayed on a screen of a given definition. This reduction will have to be done via a processing which is in fact a filter. And the choice of a filter has a consequence on the graphic representation which is given of the signal and which may not have much to do with its real representation, such as one could see it on an analog oscilloscope for example. It is therefore necessary to say a few words about filters, their interest and their limits.
A filter is a process whose purpose is to highlight certain phenomena and/or to eliminate others. The result of the application of a filter to the raw signal therefore modifies the shape of this signal, sometimes in a very significant way. Let's take some examples:
- Some signals may present spurious noises which do not provide any particular information. Suppose there are thin, high peaks from time to time. These peaks can come from a particularity of the sensor for example. A filter may have the purpose of removing these parasitic peaks which interfere with the reading of the signal without modifying the rest of the signal too much.
- When measuring the amplitude, what interests us is to determine T1 and T3. A filter may have the purpose of isolating T1 and T3 and removing the rest of the measurement in order to allow the measurement of the time interval. The resulting signal may consist of only two bars (T1 and T3), the rest of the signal having disappeared.
- Any measurement system introduces background noise which in practice has nothing to do with the useful signal. A filter may have the purpose of suppressing this background noise without excessively altering the useful signal and without causing parasitic phenomena close to the background noise to disappear.
There are all kinds of digital filter algorithms. But obviously, not all of them are applicable to a particular field.
In PC-RM4, four filters are available as of the date of this writing (June 2022, explanation revised in March 2026). More may be added later if they are useful.
As a preliminary step, the TICK or TOCK signal (its voltage) is captured in an array at a given sampling rate. The average of all the captured values is called the "average value" of the signal. This average value is displayed in the center of the screen window that displays the analog value of the signal.
The first filter (F0) displays the signal as it is captured, with formatting to fit on the screen. It is also mirrored: signals below the average value are duplicated above the average value, and signals above the average value are duplicated below the average value.
It's also important to consider that, depending on the sensor chosen, the signal amplifier can also modify the signal due to the filtering it performs. For example, the PC-RM4's internal amplifier has a bandpass filter to eliminate noise from the mains power supply and high-frequency interference.
Nevertheless, what is displayed on the screen can be considered the most accurate representation of what the watch produces, within the sampling frequency.
The second filter (F1) takes the values from filter F0 and then calculates a moving average of each point in the signal. In practice, this filter tends to smooth the signal curve's envelope and provides the most visually appealing results. It also eliminates a large portion of the background noise. However, as a consequence, a low-amplitude signal will tend to disappear from the display.
The third filter (F2) takes the values from filter F1 and then performs processing to enhance the rising slopes of the signal and attenuate the falling slopes (in this explanation, we only consider the signal above the average value).
Let "t" be the time it takes to capture a signal relative to T0 (the start of capture). We denote Vt as the signal value at time t and Vt+1 as the signal value at t+1. These values are those calculated by filter F1 and are derived from the voltage (volts) of the captured signal. For each t, the following processing is performed:
- If Vt+1 is greater than Vt, then the displayed signal is Vt+1. We then initialize a variable T = t+1.
- If Vt+1 is less thanVt, then the displayed signal is the result of an attenuation function f(Vt) in Vt.e(-ΔT/A), where ΔT is the time elapsed between t+1 and T. The value "A" is a constant obtained experimentally.
- If Vt+1 is less than Vt, then the displayed signal is Vt.e(-ΔT/A).
- IfVt+1 is greater than Vt, then the displayed signal is Vt+1 and T = t+i.
This filter is particularly effective at highlighting T3 (and to some extent, T2).
The fourth filter (F3) visualizes only the upper part of the signal compared to its average value (the lower part is brought back to the upper part). It favors the rising edges and applies an attenuation function to them on their falling part. It is not very interesting visually but can help in the identification of T1 and especially T3.
The lift angle calculation uses the result of filter F2. Let t3 be the time corresponding to the highest value of the captured signal, and "threshold" the value of a threshold assumed to be greater than the average value:
threshold = average value + ((average value) / 4)
Starting from t3, the program searches for the first signal value for t < t3. This "t" is taken as the time value corresponding to the beginning of T3.
The program eliminates outliers (< à 90°, > à 360°, t = 0).
Simulation mode
In simulation mode, the timing machine generates the signal of a watch which has an offset of [+100µs, -110µs] around its half-period with small variations which vary between 10µs on either side.
This small variation results in a difference between the Tick and the Tock of about 180µs and a difference over the period which can vary between a little less than 10µs up to almost 2ms depending on the selected beat: the reason for this significant difference comes a side effect of the implementation. In simulation, the time for the period and the half-period of a beat is given in milliseconds (whereas in real measurement, the times are calculated in nanoseconds). Consider a beat of 19,800 beats per hour. The remainder of the division of 3600 by 19800, 0.181818181... The integer part of the half-period of the beat is therefore 181 in milliseconds but is worth 181181181 in ns. There is therefore a difference of 181181 ns which is not negligible compared to 24:00. This edge effect was considered interesting because it allows us to see how the display varies when a watch is very out of adjustment.
Depending on the setting (see "Settings"), it is possible to change the direction of the shift, which causes either an advance (the signal will move upwards by screen), or a delay (the signal will move down the screen).
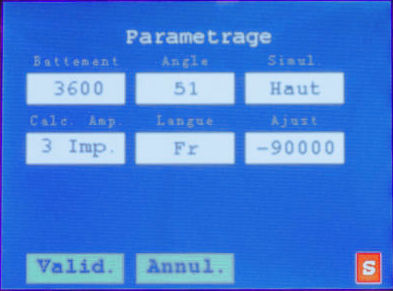
Settings
Some parameters of the chronocomparator can be modified via the configuration screen:
- Specific beat: from 1 to 99999. It will appear on a yellow background in the beat selection menu.
- Lift angle: from 10° to 90°. As a reminder, the most common value is 51°.
- Orientation of the rate curve of the watch when in simulation (up or down).
- Language of use (French by default. English is also implemented in the basic version).
- Adjustment (calibration) of the chronocomparator.
To change a setting, just tap on it with the stylus.
Two output options are available: "Validate", the values entered are validated and saved in the saved memory, "Cancel", the values entered are ignored, the original values are not modified.
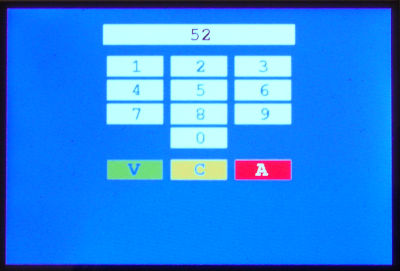
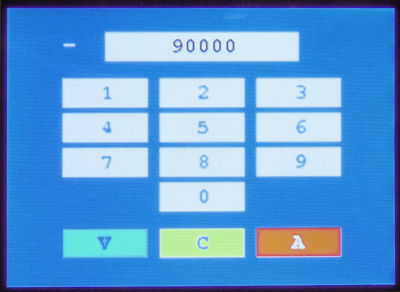
For values requiring numeric entry, the program displays a basic keyboard with a display that displays the current value of the parameter. The keyboard features:
- 10 digits (0 to 9).
- A "V" button which validates the data entered and allows you to return to the previous screen.
- A "C" button, which sets the display to the value 0 (zero).
- An "A" button, which allows you to return to the previous screen without taking any input into account.
- Depending on the case, a "+" or "-" sign. The sign is changed by selecting it on the screen. If the sign is "+", it passes "-" and vice versa.
User language
The default language is French. English is also implemented. It is very simple to add another language (the texts are grouped together in a single place) but you have to recompile the program.
Adjustment (calibration)
 Like any measuring device, the chronocomparator may require calibration. In this case, it is necessary to determine the value to add or subtract from the time measured for a Tick or a Tock so that it is correct.
This value depends on several factors that cannot be determined in advance: quartz precision, signal transit time, etc.
To make the adjustment, you need to have a reliable time base. It can be:
- A precise low-frequency generator. In this case, set the generator to generate one pulse per second under a voltage between 1 and 2V peak (the duty cycle is not critical as long as it remains below 50%. As far as my tests are concerned , it is 6.5%.) and inject the signal on the external input of the chronocomparator.
- Alternatively, an accurate quartz analog watch with a hand marking the seconds. In this case, place the watch on a sensor connected to the amplified input (if the sensor is not amplified) or external (if the sensor has its own amplifier).
Take a time measurement and note the difference (or average of the difference) from the expected time period. Suppose it is -90.0µs.
Go to the settings screen and enter this value in nanoseconds (complete with 0s). For -90.0µs, you would therefore enter -90000.
Validate the entry and redo the measurement. You should get a difference of 0.0µS. If so, the chronocomparator is calibrated.
The value is saved in permanent memory.
The default calibration value is -90000 which happens to be that of the PC-RM4 prototype.
What to do if...
The synchronization indicator is red. The front LED is always on or off.
Check that you have the sensor plugged in and that a working watch is on it.
Check that the sensitivity level is sufficient (adjustment by potentiometer).
Check that you have selected the correct beat.
You can check for the presence or absence of a signal as follows:
- Select the "measure" function then "scope".
- In the "scope" function, deselect the acquisition on synchronization ("S" button at the top of the screen which is in red (active) in the general case. When you deselect it, it turns green (inactive).
- Look at the signal on the screen. If you have a continuous line with very small variations, it means that no signal arrives on the timer. If the level of sensitivity does not act or if it only increases or decreases the background noise, it is possible that the sensor is badly connected or faulty (wire disconnected in a socket for example).
- If there is a strong signal across the entire screen, the sensor may be wired incorrectly. It is also possible that the device is not plugged into a grounded outlet. Finally, it is possible that a device (or lighting) located near the timer is emitting interference.
- If you have a typical clock periodic signal, chances are you have selected the wrong beat.
The synchronization indicator changes from red to green permanently. The LED on the front flashes irregularly.
Act on the sensitivity by decreasing or increasing it. A level that is too low means that certain signals will not be detected, causing synchronization to be lost. Conversely, too high a sensitivity can introduce spurious signals from the background noise.
Check that you have selected the correct beat. If in doubt, try several. Keep in mind that this may be a non-standard beat. The parameterization function allows you to enter non-standard beats.
In the time measurement screen, dots appear anywhere on the screen.
It is likely that the zoom is too high. Press the "-" key until the display shows a single line or two more or less parallel lines. As a reminder, the number displayed on the left of the screen in the graphic display area indicates the number of µs per pixel on the screen. If it displays 1000µs, it means one pixel represents 1ms. If it displays 1µs, one pixel represents 1µs. If at minimum zoom (100µs), the dots continue to appear anywhere on the screen, it is likely that you have a severely out of adjustment watch with a very large difference between the Tick and the Tock. The watch must first be serviced before attempting to adjust its rate.
In the time measurements screen, the trace of the rate of the watch is almost vertical.
You have a watch with a very high lead or lag. Look at the "F/S Day" value to convince yourself of this. Note that the trace will tend all the more towards the vertical as the zoom is high.
The amplitude values seem high.
At maximum zoom, if the signal moves a lot from right to left and from left to right, it is likely that the sensitivity is not sufficient. As a result, from time to time, the measurement is triggered on T1 and other times, on T2 or T3. Try increasing the sensitivity.
IMPLEMENTATION
Schéma bloc
The block diagram looks like this:
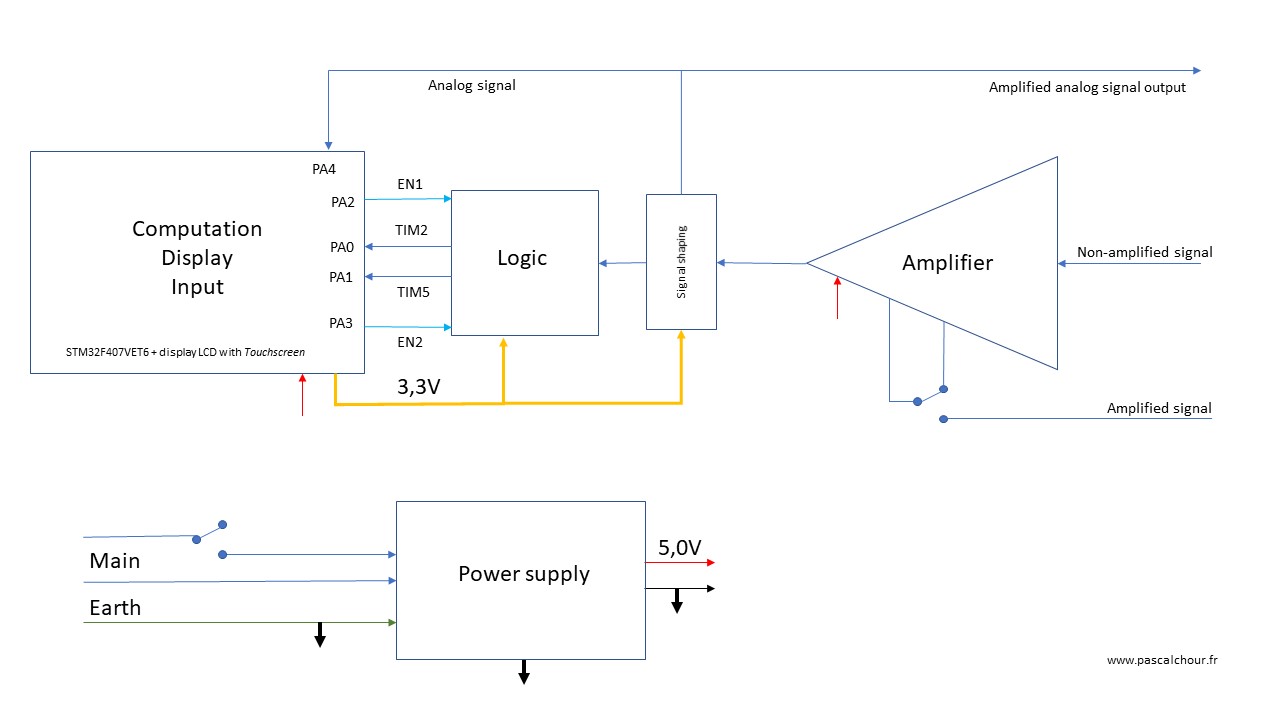
Power supply
The device connects directly to the mains with earth connection. The power supply delivers a continuous voltage of 5V. The power consumption is around 170mA.
Computation module
The "computation, display, input" block is an STM32F407-based development board with a LCD TouchScreen screen. It is supplied with 5V DC (red on the diagram) and delivers a voltage of 3.3V (orange on the diagram) which is used to power other parts of the device.
Amplifier
This is a montage adapted from that proposed by the Watchoscope site. It uses a quad operational amplifier.
Logic
This block transforms the analog signal into a logic signal according to an automaton which is described later. It is made up of a double J/K flip-flop and is supplied with 3.3V (orange on the diagram).
Attenuator
It is comparable to a potentiometer intended to attenuate the output signal of the amplifier.
Overview
The non-amplified signal typically comes from a piezo sensor which reacts to the shocks generated by the ticks and tocks of the watch to be adjusted. This signal is very low in voltage and must be strongly amplified to be exploited.
You can also connect the sensor of an existing measuring device, such as the one associated with the Vibrograf, the Bandelin tickoprint or any equivalent device.
It should nevertheless be aware that the signals generated by these sensors have a higher voltage than those generated by the simple piezo sensor that I use. There is therefore a risk of saturating the amplifier's input signal. If this is the case, it will be necessary to add an adjustable resistor at the input in order to avoid saturation.
If you have an already amplified sensor, you can also connect it to the chronocomparator on the input provided. A contactor makes it possible to select either the output of the amplifier, or the signal already amplified as a source for the logic block which processes the signal.
For signals already amplified, care should be taken that the injected voltage does not exceed 3.3V.
The logic block is controlled by the processing module and delivers two signals making it possible to control the counting of the timers of the microcontroller.
The analog signal output from the attenuator is also supplied to the processing module for analog display of the signal (scope function) and is available on an output socket of the device to, for example, display it on an oscilloscope or the process on a computer via the "microphone" input.
Electronic schematic
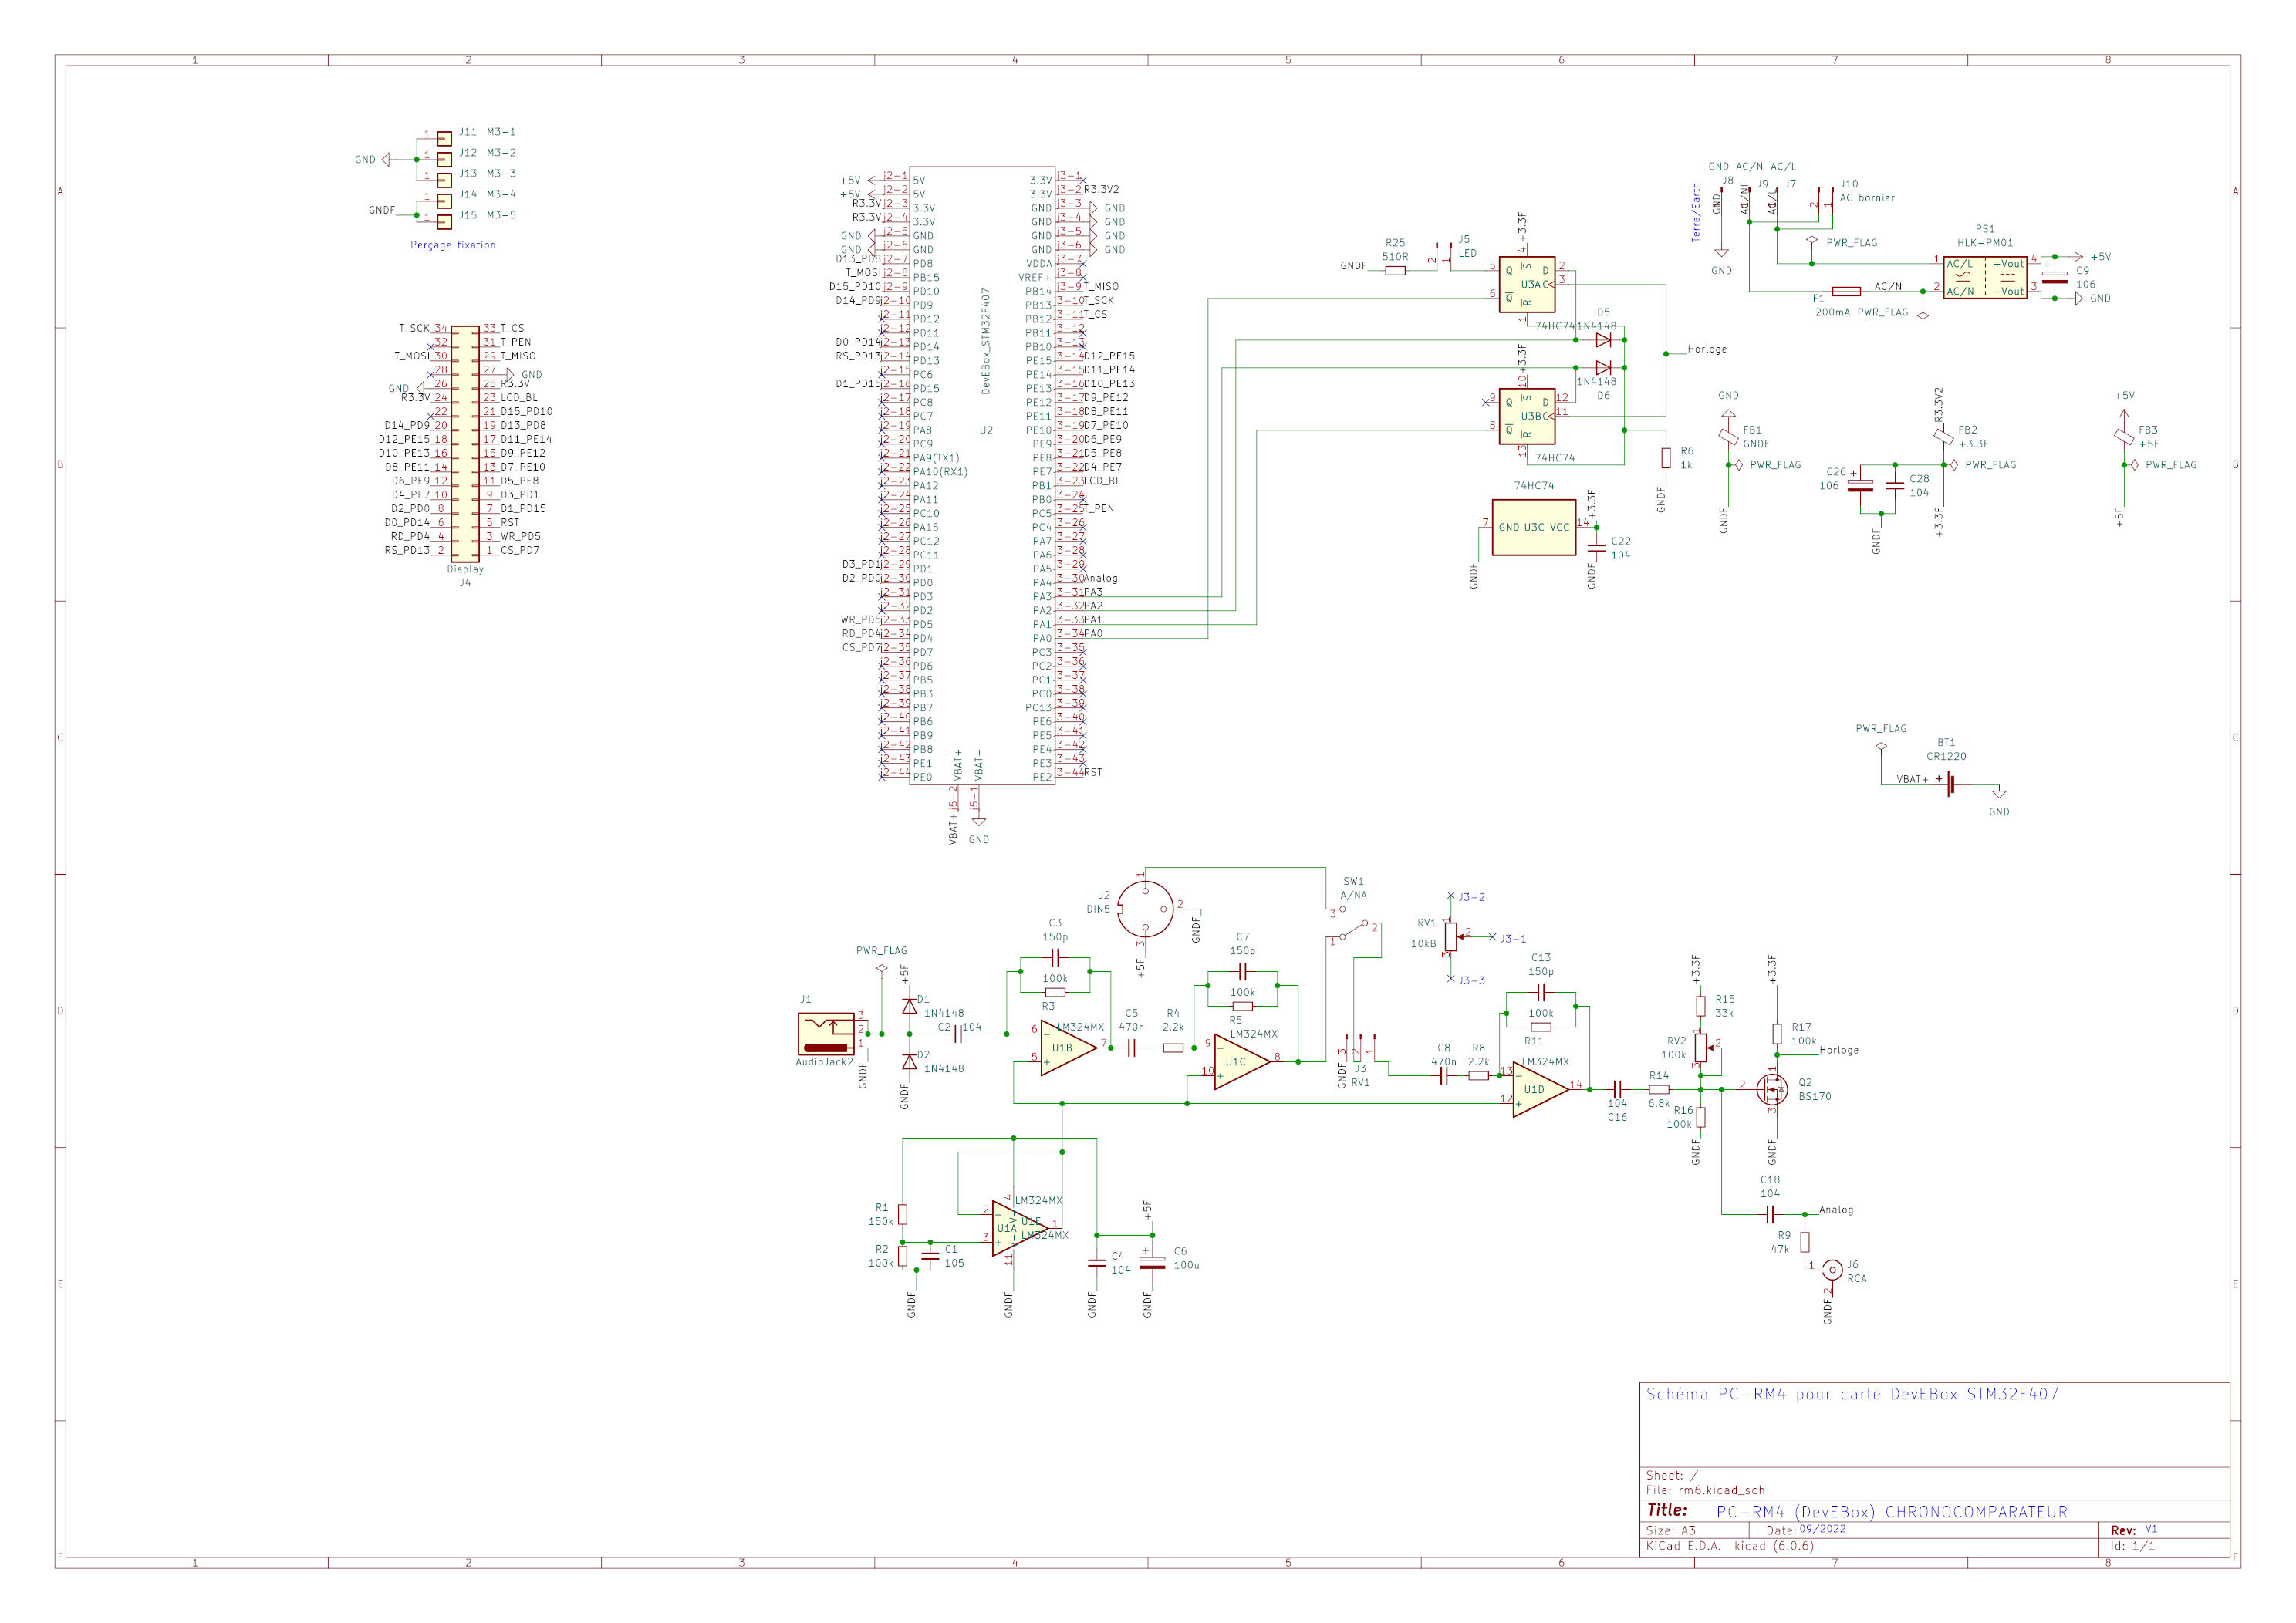
Click to enlarge
Amplifier
For the amplification of the signal from the piezo sensor, we can use the principle of the diagram proposed on the Watchoscope site with however some modifications. I used it for PC-RM1 and PC-RM3 and it works perfectly.
it uses a quadruple operational amplifier LM324 (U1).
Some explanations :
- U1A is used to generate a voltage which is a portion of the supply voltage (5V). The average voltage is given by the divider R1 and R2 and is established around 2V. How about 2.5V (half the supply voltage)? Probably because of the threshold voltage of the LM324 inputs. Moreover, the ideal value for R2 is rather 90kohms but this is a non-standard value.
Practically, the voltage of the output signal will therefore vary between 0V and approximately 4.4V before saturation.
With 90kohms for R2, the symmetry between the low part of the signal and the high part with respect to the average value is perfect. With 100kohms, the high part will saturate a little faster than the low part of the signal, but this is of no great consequence.
A difference with the schematic proposed by Watchoscope is the the filter chemical capacitor removal on the divider which is not useful and which can even introduce a parasitic noise. On the other hand, I put 1µF rather than 0.1µF for C1. In any case, do not use chemical capacitors for this part. - U1B, U1C and U1D form the amplification chain with an active filter which eliminates low (mains, 50Hz) and high (11kHz) frequencies. The diagram is close to that of Watchoscope with the following differences :
- Removal of 33k input from U1B. I think the designer had a sensor whose signal output level was saturating the amplifier and he put this resistor to avoid this saturation. Conversely, if you have an insensitive sensor, you risk having too weak a signal at the output for there to be synchronization.
- Gain control at the output of U1C and not at the output of U1D in order to avoid the saturation of U1D in the event of a high input signal. A 10kohms (Log) potentiometer does the job very well. It is the most important and most useful modification compared to the initial assembly.
- Installation of diodes D1 and D2 to eliminate the risks of overvoltage generated by certain sensors at the input of U1B.
The others modification are more related to functional or situational aspects.
- Q2 is used to generate the measurement trigger signal (input "h" of the J/K U3A et U3B). The bias voltage of Q2 (on its gate) must be set via RV2 between 1.9 to 2V. Too low, Q2 will trigger permanently or as soon as there is a small noise on the captured signal, too high, it will only trigger on high level signals.
- Resistor R14 is used to limit the analog voltage to around 3V so as not to damage the microcontroller. Its value (10k) was calculated without taking into account the input impedance of the analog to digital converter. In use, you can go down to 6.4kohms (what I put).
- There is an input for a sensor delivering an already amplified signal via a DIN socket, two pins of which are used to provide a 5V power supply.
- An output of the amplified analog signal is available on an RCA socket via a 47K resistor.
Logic circuit for counting
An internal clock of the processor (42 to 84 MHz) provides a clock AB1 which will supply 32-bit counters (TIM2 and TIM5) of the microcontroller, the counters being controlled by a control logic made around two flip-flops U3A and U3B controlled by the microcontroller . This is the main novelty of PC-RM4 compared to the previous PC-RM1 and PC-RM3 chronocomparators, the control of the counters is independent of the activity of the microcontroller.
| U3 | Microcontroller | ||
| U3A/Q (6) | Counter 1 | PA0 | TIM2 |
| U3B/Q (8) | Counter 2 | PA1 | TIM5 |
| U3AD (2) | PA2 | ||
| U3BD (12) | PA3 | ||
| Clock | U3AC and U3BC | ||
| Analog | Analog signal | PA4 | Analog input |
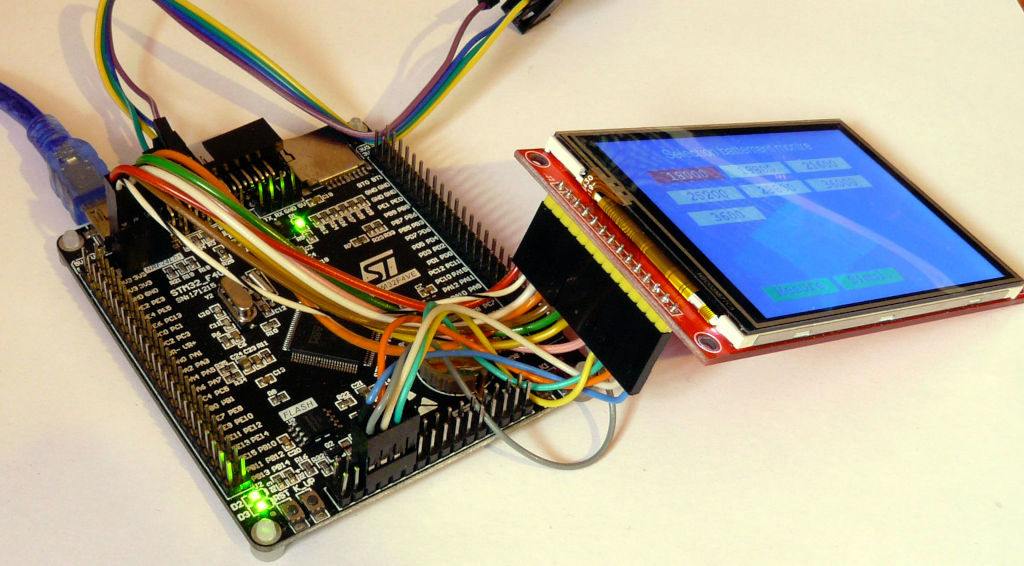
Microcontroller board
The microcontroller is a STM32F407 168MHz. The development board is a DevEBox.
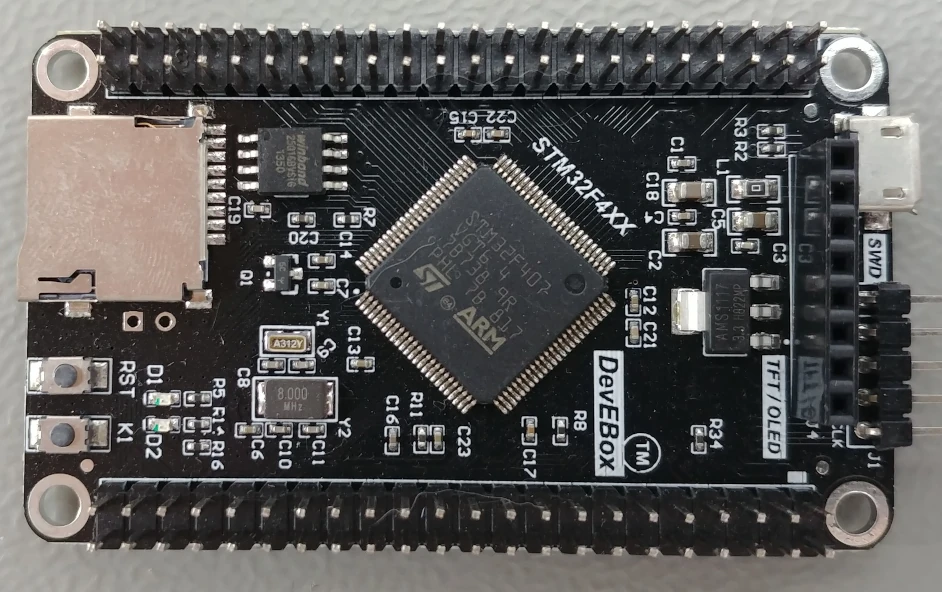
DevEBox, front side
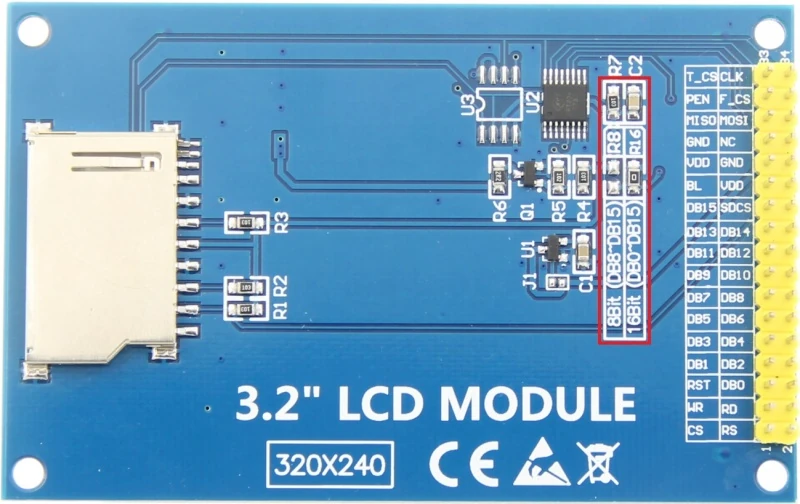
Display
The display used is a 3.2" TFT LCD Color MBR3205 320x240.
Sensor
The standard sensor uses a piezo module
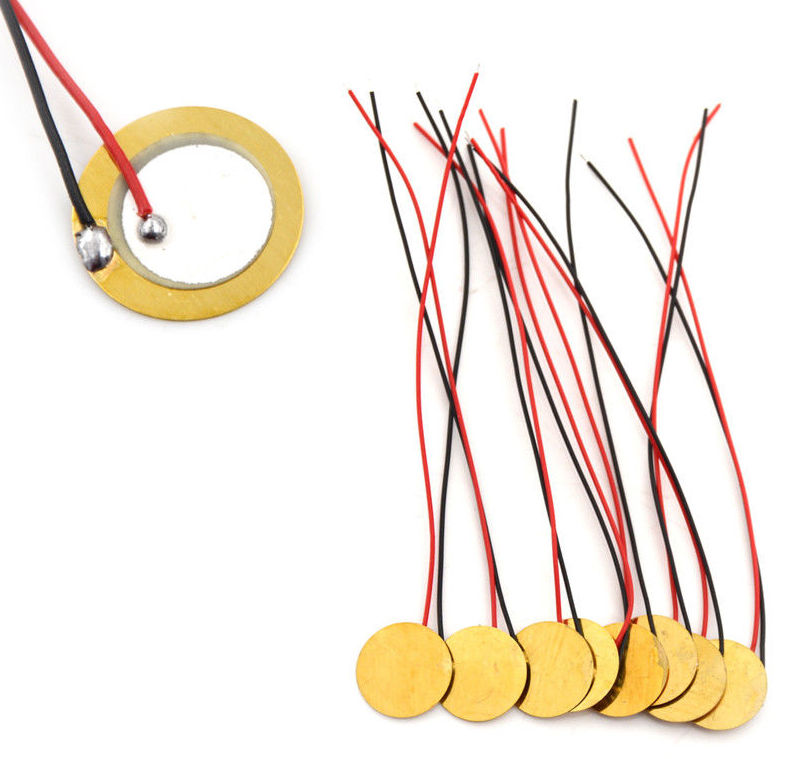
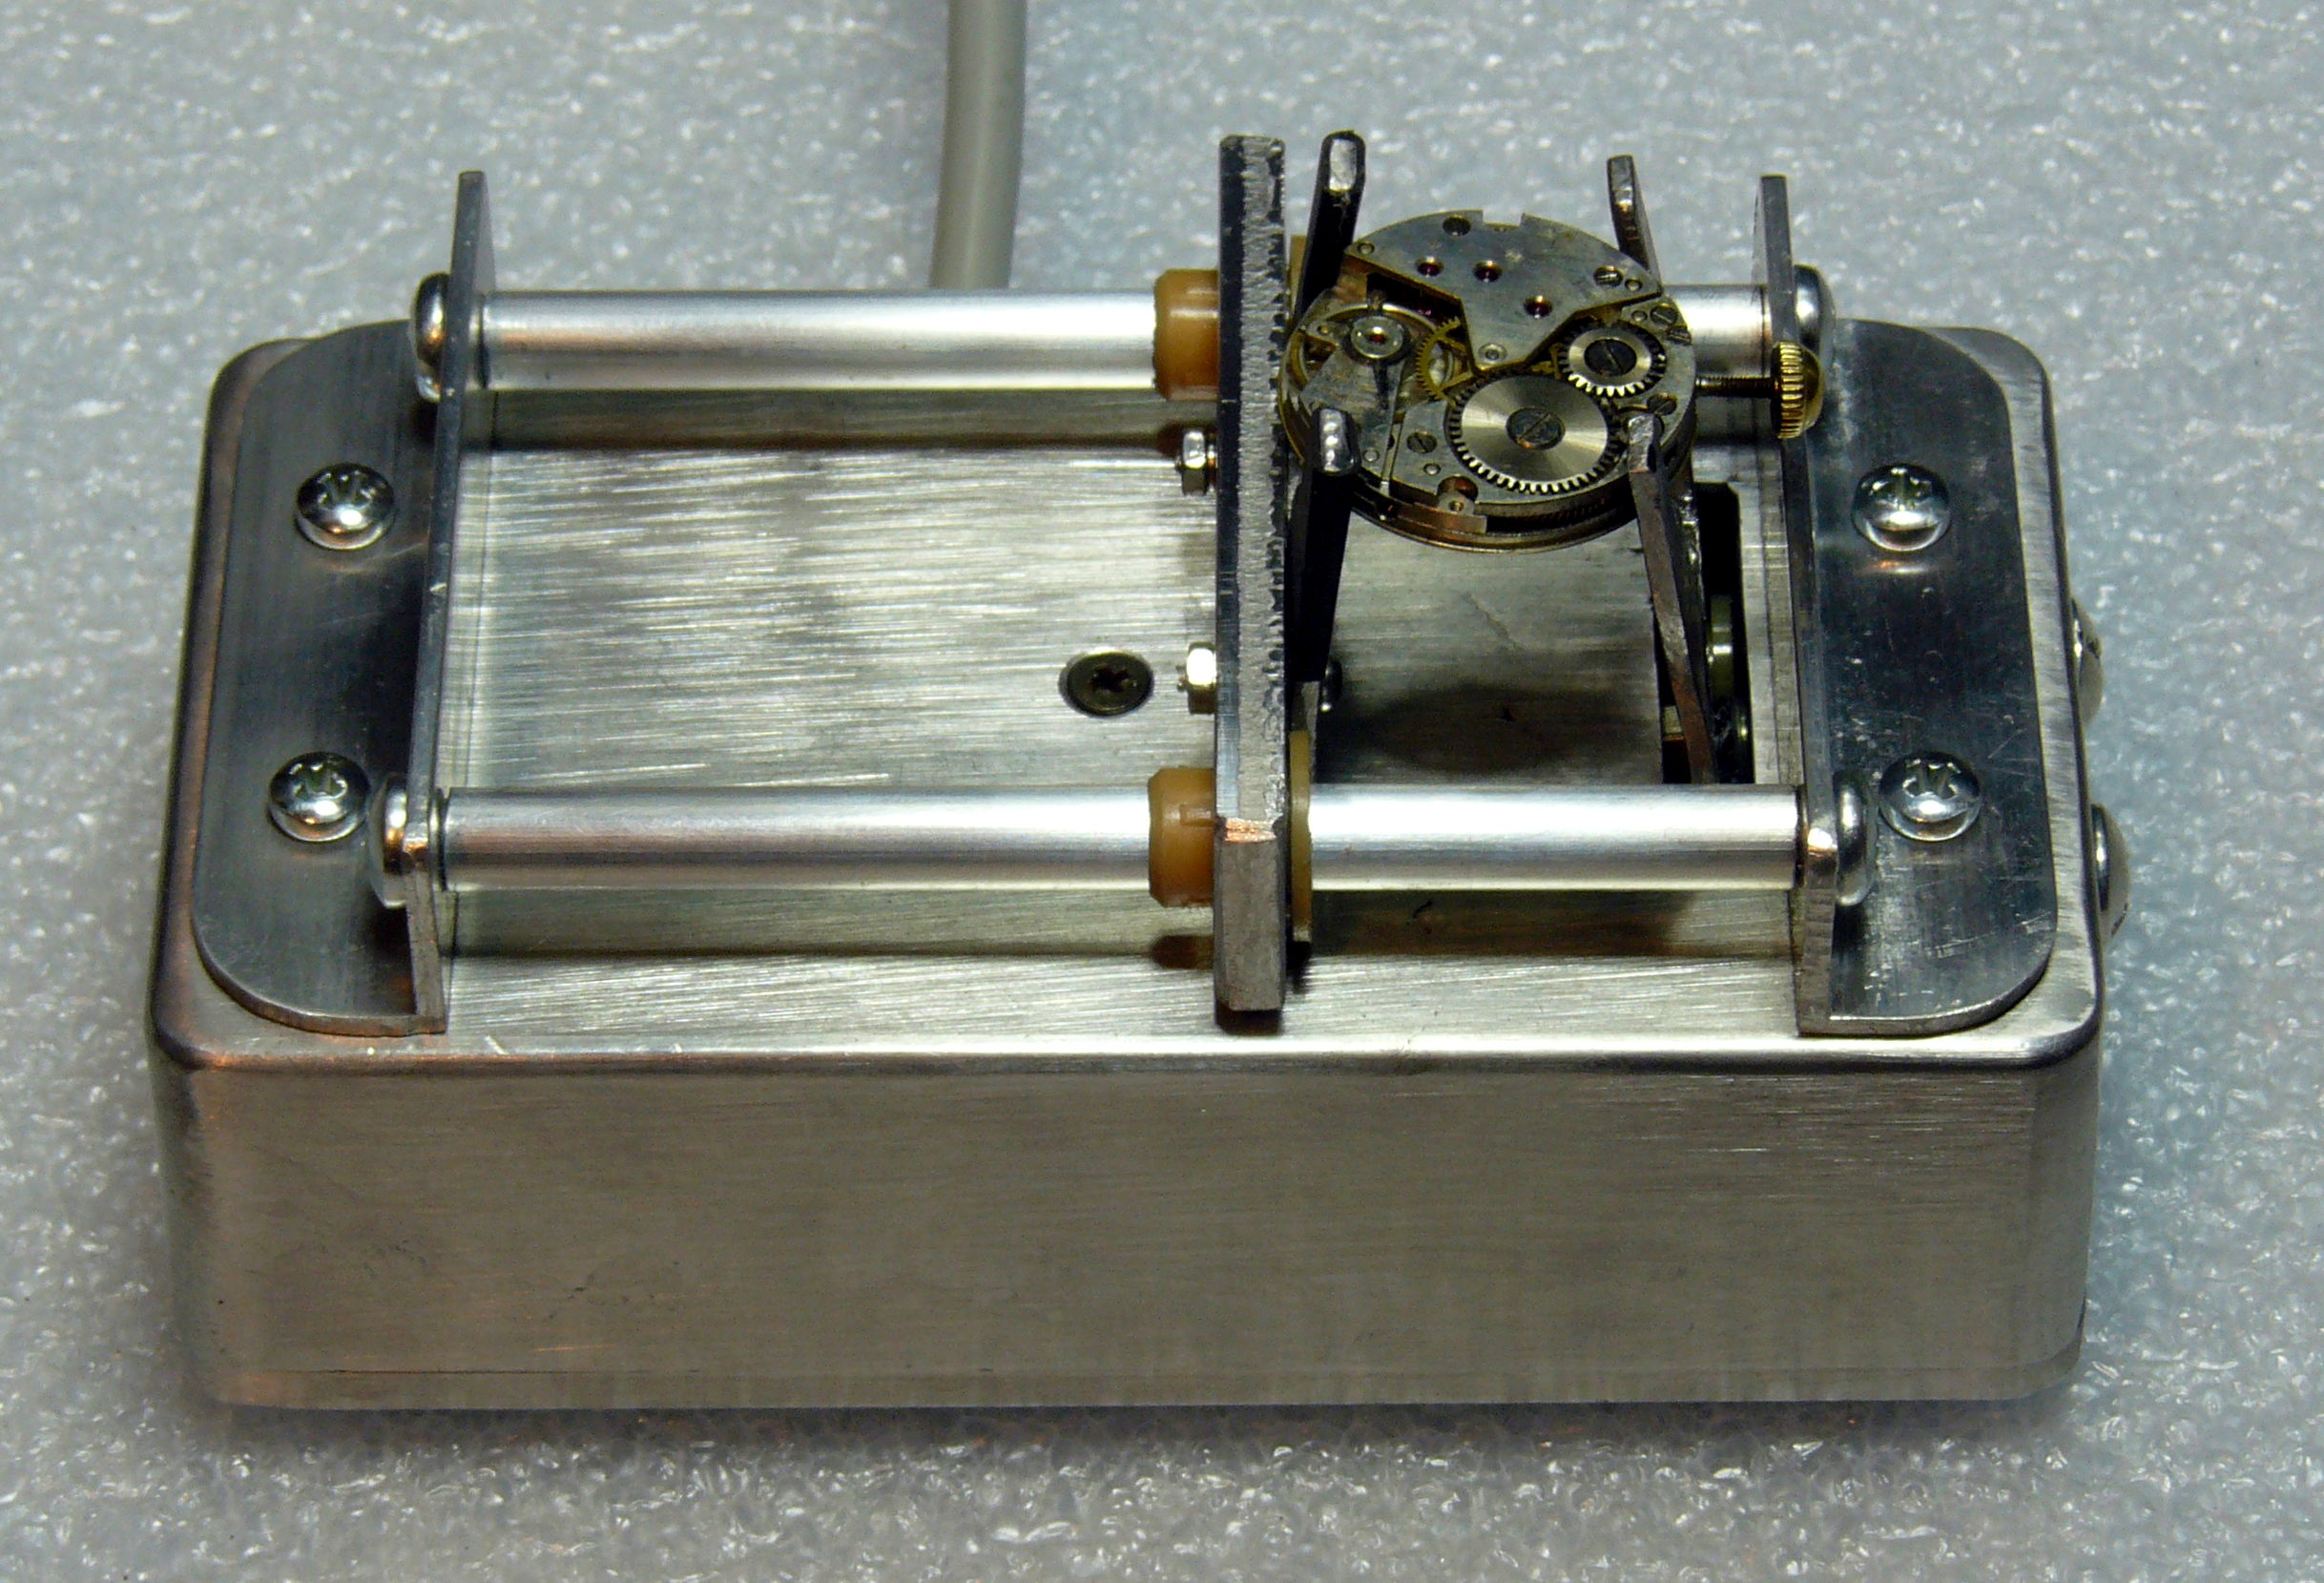
This sensor can be put in a vice designed for repairing watches. With a little work, it is also possible to make a suitable mechanism such as the one proposed on this page
PCB
At this point, you have two options :
- Make a wiring "in the air" and make the amplifier part, logic for counting and power supply on one or more test circuits. It's an inexpensive solution to consider if you know electronics and are already equipped.
- Use the circuit board that I had made. This is the simplest solution. It limits the risk of errors and facilitates interconnections.
Thereafter, I will detail only the realization based on printed circuit.
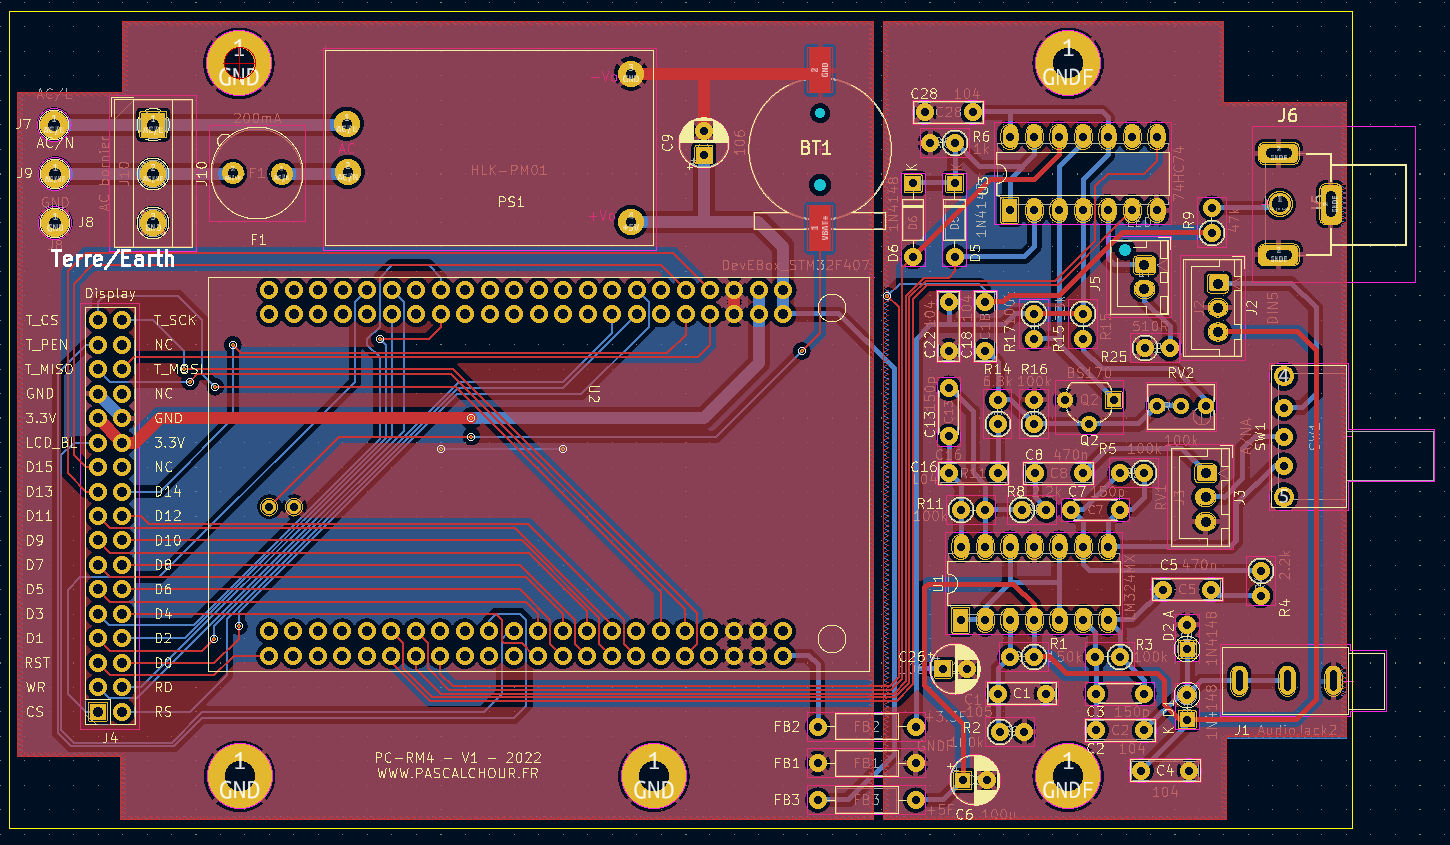
PCB components side
You can download the .zip file containing the manufacturing files for the PCB. This version fixes two errors compared to the one I originally had manufactured: :
- 3 missing tracks.
- A reversal on the screen connector that required crossing the wires in pairs.
I should point out, however, that I have not tested this new version of the printed circuit board myself.
Assembly
Quelques informations sur le montage :
- The "display" connector is used to connect the LCD screen via a cable.
- J7 and J9 are for AC power. It is also possible to connect it to J10.
- J8 is for the earth circuit (mandatory).
- BT1 receives the CR1220 battery which is used to maintain the saved memory.
- J3 is for the 10KB potentiometer.
- J5 is for the LED which flashes according to the beats of the watch. The cathode must be connected on the resistor side. Resistor R25 (510 ohms) is intended for a modern LED. If, like me, you have old LED stocks (1980s-1990s), I advise you to put a 270 ohm resistor instead.
- J2 is for the DIN socket for an amplified sensor
- FB1 to FB3 are ferrites. The idea is to filter any high frequencies that could be generated by the processor via the power supply. Honestly, I'm not sure they are useful but as I had plenty, I put some. You can replace them with simple straps.
- All components are through-hole (except BT1) to facilitate assembly by those who are not equipped to solder SMDs.
- The precision of the passive components is not critical. For resistors, 5% or less, 1/4W or more except possibly for R1 and R2 (ideally 2%) and R25 (1/2 W).
- On the display (model MBR3205), remember to bridge J1 (J1 short-circuits the voltage regulator) as it is powered by 3.3V.
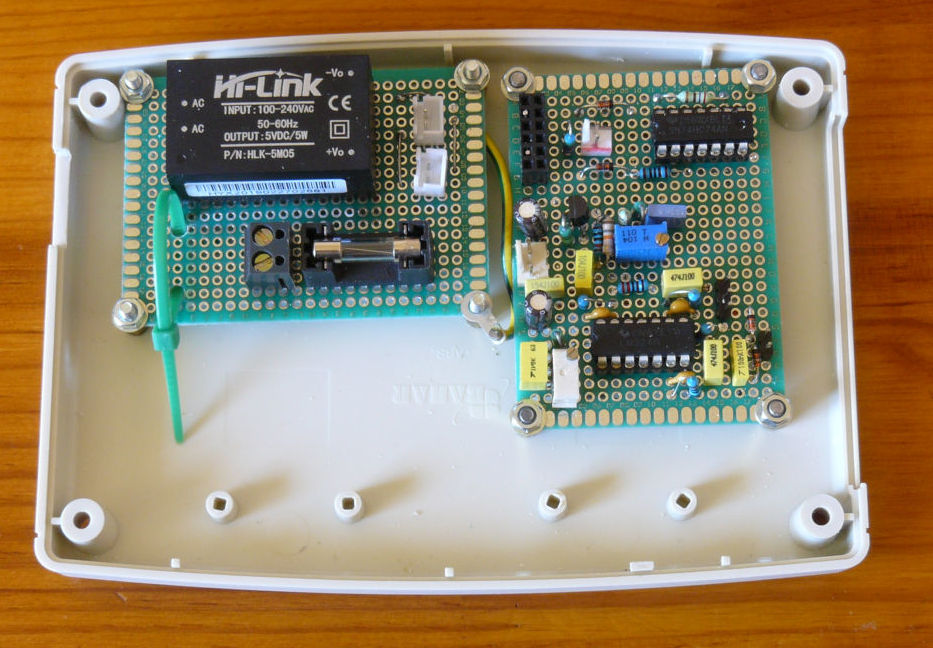
Here is a view of the assembled circuit (this is the prototype version, there are some corrections on the V1 printed circuit in the photo).
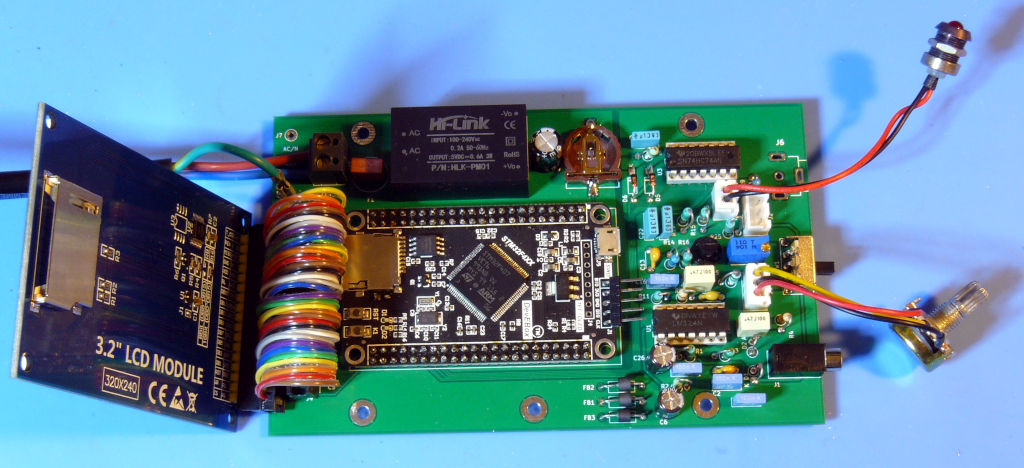
PCB populated with the components
For resistors and capacitors, I took what I had in stock. The capacitors are oversized (35V operating voltage for chemicals, 63V to 100V for others). If you have to buy some, no need to take these fanciful values... The highest voltage on the circuit is 5V. You can therefore take 10V for the chemicals.
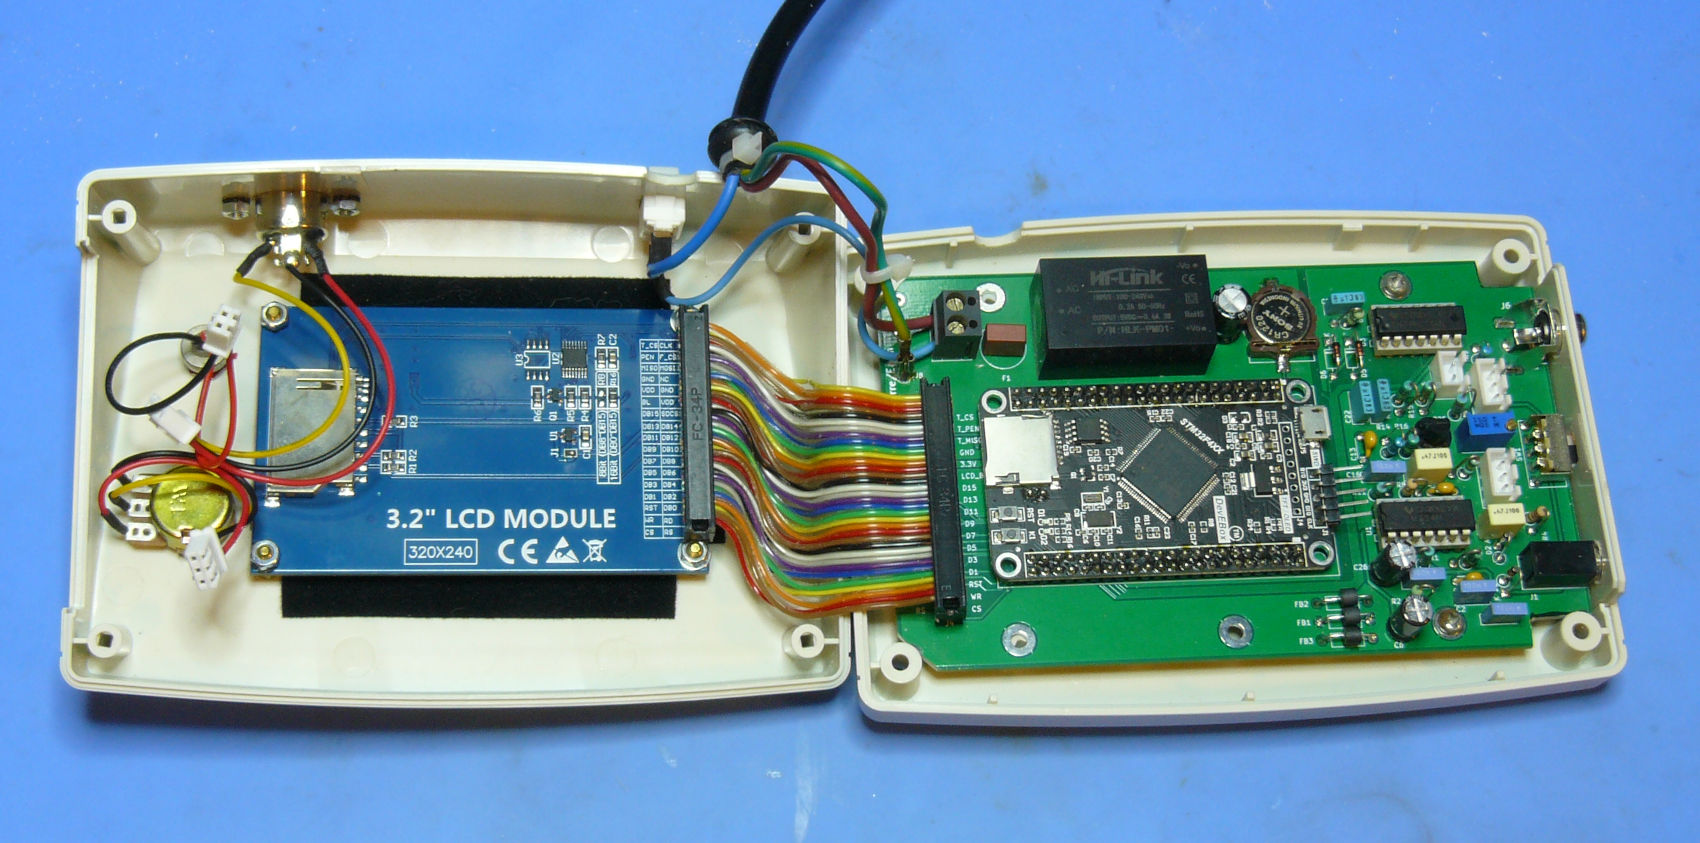
PCB populated with the components in its box
Summary of components :
| Ref schematic | Ref. | Qty | Value |
| U1 | DIP-14_W7.62mm_LongPads | 1 | LM324 |
| U2 | DeveBox STM32F407 | 1 | DevEBox_STM32F407 |
| U3 | DIP-14_W7.62mm_LongPads | 1 | 74HC74 |
| Q2 | TO-92_Wide | 1 | BS170 |
| D1,D2,D5,D6 | D_DO-35_SOD27_P7.62mm_Horizontal | 2 | 1N4148 or BAT85 |
| LED | 1 | Standard model | |
| C1 | C_Rect_L7.0mm_W2.0mm_P5.00mm | 1 | 1µF |
| C5,C8 | C_Rect_L7.0mm_W2.0mm_P5.00mm | 2 | 470nF |
| C26,C9, C6 | CP_Radial_D5.0mm_P2.50mm | 2 | 100µF 10V |
| C22,C28,C18,C16,C4,C2 | C_Rect_L7.0mm_W2.0mm_P5.00mm | 6 | 100nF |
| C3,C7,C13 | C_Disc_D4.3mm_W1.9mm_P5.00mm | 3 | 150pF |
| R1 | R_Axial_DIN0207_L6.3mm_D2.5mm_P2.54mm_Vertical | 1 | 150kohms |
| R4,R8 | R_Axial_DIN0207_L6.3mm_D2.5mm_P2.54mm_Vertical | 2 | 2.2kohms |
| R11,R3,R17,R5,R2,R16 | R_Axial_DIN0207_L6.3mm_D2.5mm_P2.54mm_Vertical | 6 | 100kohms |
| R9 | R_Axial_DIN0207_L6.3mm_D2.5mm_P2.54mm_Vertical | 1 | 47kohms |
| R6 | R_Axial_DIN0207_L6.3mm_D2.5mm_P2.54mm_Vertical | 1 | 1kohms |
| R14 | R_Axial_DIN0207_L6.3mm_D2.5mm_P2.54mm_Vertical | 1 | 6.8kohms |
| R15 | R_Axial_DIN0207_L6.3mm_D2.5mm_P2.54mm_Vertical | 1 | 33kohms |
| R25 | R_Axial_DIN0207_L6.3mm_D2.5mm_P2.54mm_Vertical | 1 | 510 ohms or 270 ohms |
| RV2 | Trimmer vertical 3296W | 1 | 100kohms |
| P1 | Potentiometer log (piste B) | 1 | 10kohms B |
| J1 | Jack_3_5_PJ316 | 1 | AudioJack2 |
| J2 | DIN5 ou 3 | 1 | DIN 5 or 3 pins. |
| J6 | RCA | 1 | RCA |
| J10 | TerminalBlock_MetzConnect_Type101_RT01602HBWC_1x03_P5.08mm_Horizontal | 1 | |
| SW1 | SW_SS12F23_Angled | 1 | Switch SS12F23 |
| F1 | Fuse:Fuseholder_TR5_Littelfuse_No560_No460 | 1 | Fuse 200mA |
| BT1 | S8411-45R_1 | 1 | For CR1220 battery |
| Con. IDC | 2 | 34-pin female IDC connectors to connect the screen to the printed circuit via a cable. | |
| Power switch | 1 | ||
| HLK | 1 | Power supply Hi-Link HLK-PM01, 0,6A. |
SOFTWARE LOAD
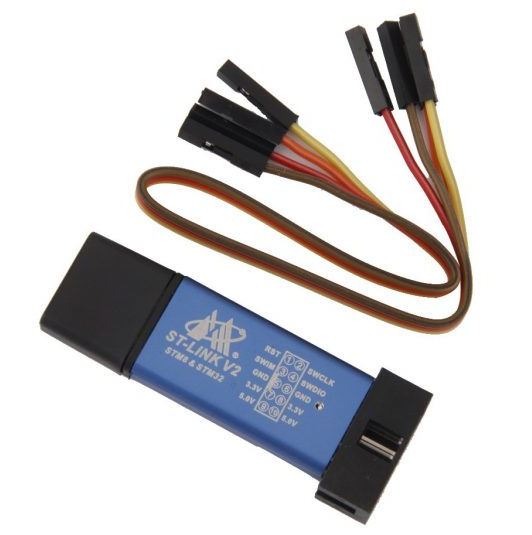
ST-LINK-V2
To load the software into the microcontroller, you will need an ST-LINK-V2 probe which is easily available for a few euros.
The connection of the probe to the microcontroller board is done as follows :
| ST-LINK-V2 | Microcontroller (J1) |
| SWCLK | CLK or SWCLK according to marking |
| GND | GND |
| SWDIO | DIO or SWDIO according to marking |
| 3,3V | DO NOT CONNECT (unless you are powering the assembly through the probe). |
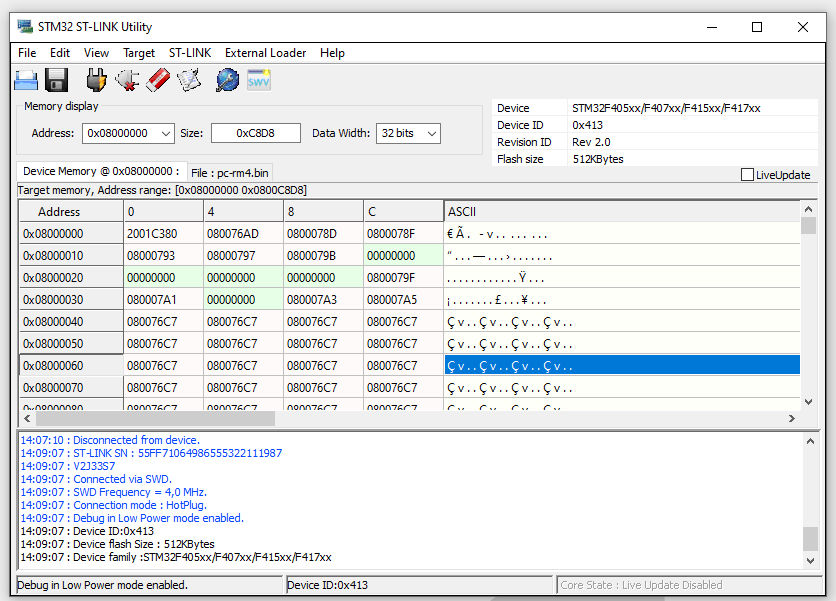
ST Link Utility
You can check that you can communicate with your ST-Link probe and that it recognizes the development board. Launch the STM32 ST-LINK Utility which is normally available for download from the ST Microelectronics website.
Select "connect to the target". If you have an error, start by unplugging the probe from its USB port, reconnecting it and selecting "connect to the target" again. I'm assuming that the connection is successful (if not, I don't know).
The utility displays the following information (some depends on the probe, development board and when you make the connection).
Probe ST-Link V2
You can take advantage of the utility being launched to update the probe's firmware. To do this, it is best to unplug and reconnect the probe from its USB port. This done, select the ST-LINK option in the menu then firmware update and let yourself be guided.
Software to download
The latest version specific to the DevEBox board and the chosen screen is available here:
I also have other versions for the STM43F4VE board with parallel 320x240 screen or SPI bus 480x320 screen. Contact me for more details but these versions are not maintained.
DERIVED VERSIONS AND ENHANCEMENTS
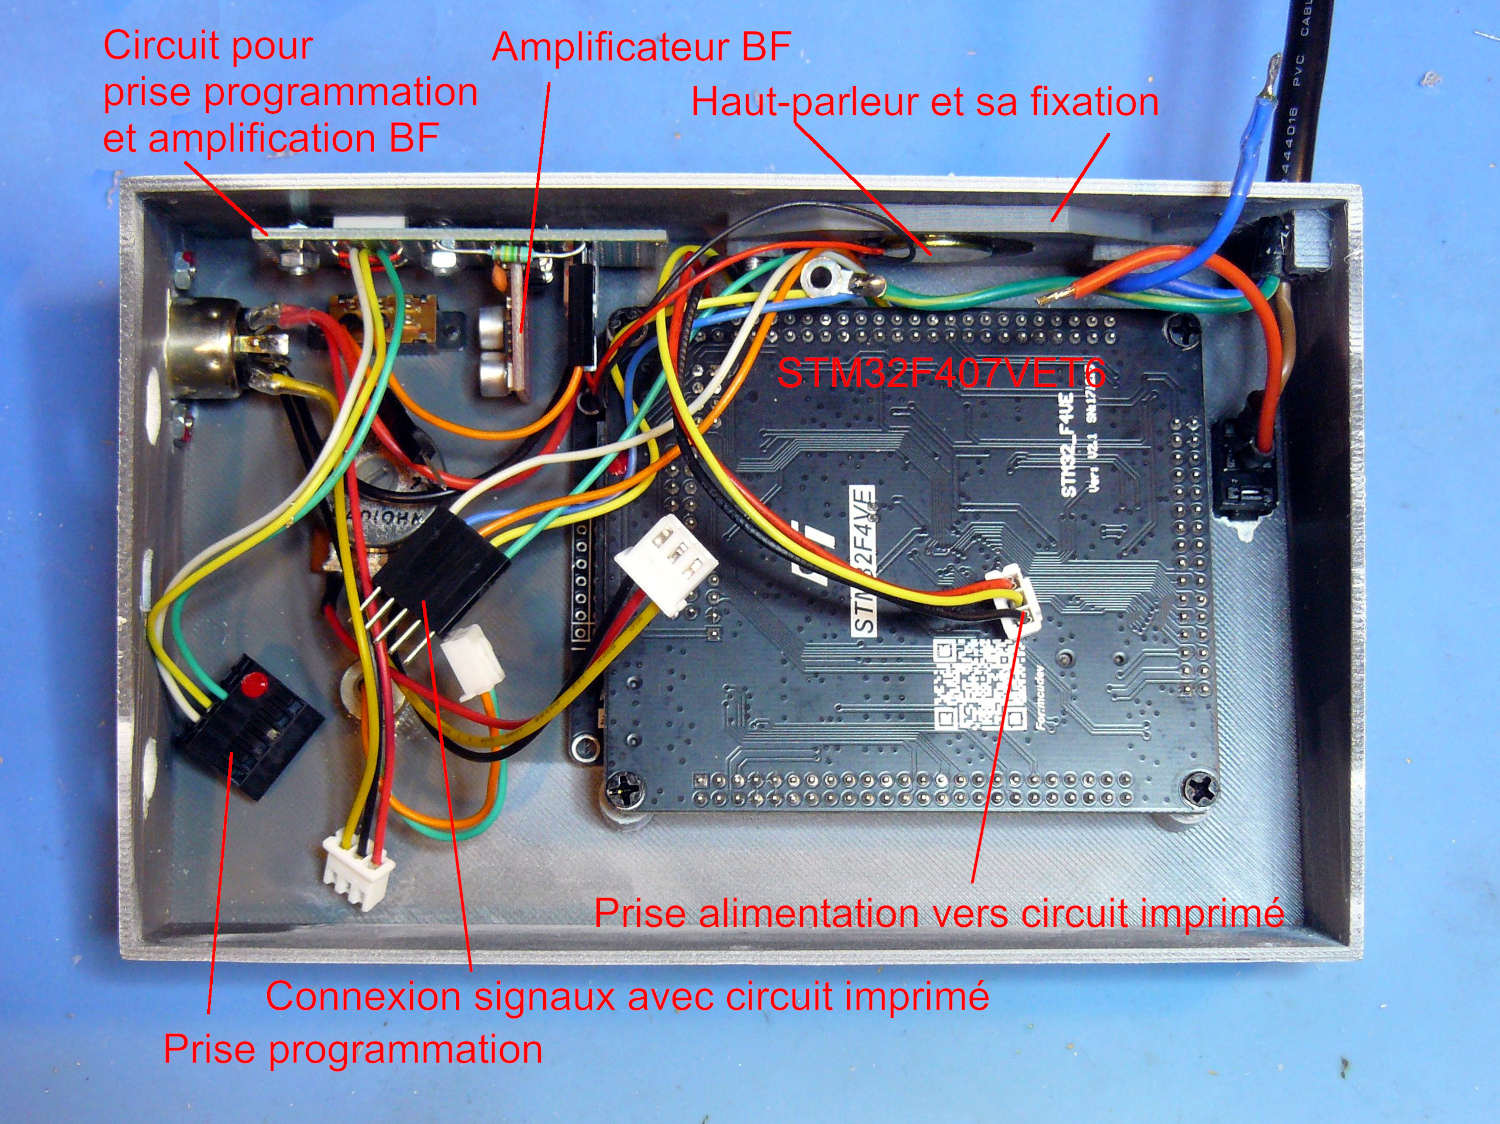
Finalized prototype
Before the version that has just been presented, I had created a prototype based on an STM32F407VET6 board and through-hole circuits. I've included some photos of this prototype at the end of this page.
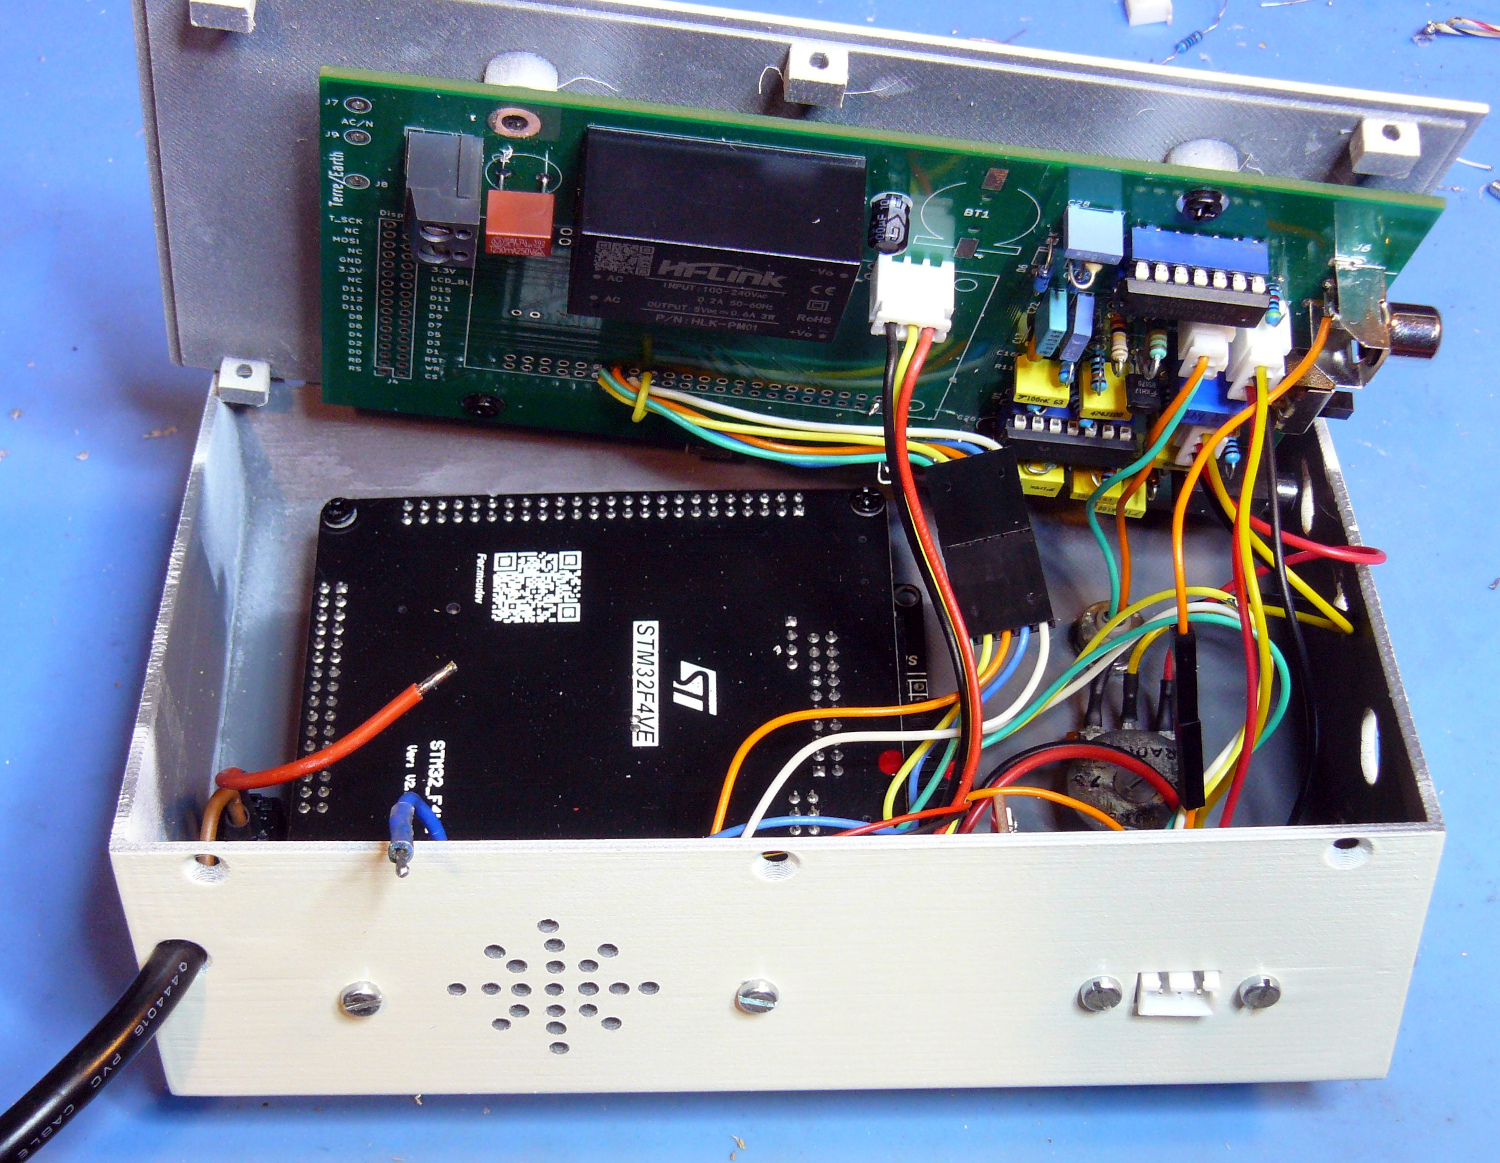
In 2026, since I still had a printed circuit board left over, I decided to make this prototype a bit more professional. I designed a 3D-printed enclosure and made the necessary adaptations for the STM32F407VET6 board. In fact, there are very few wires to connect between the STM32F407VET6 board and my printed circuit board (8 exactly) since the screen is directly connected to the STM32F407VET6 board.
This version includes two additions that are not described in the final version:
- An externally accessible port allows for software updates without disassembly.
- An audio amplifier with a built-in speaker lets you hear the watch's ticking sound.
These two additions are described in more detail later. The following photos were taken before the device was fully completed. There may be some differences compared to the explanations.
Port for software loading
I added a 3-pin connector to the back of the unit to connect the ST-LINK-V2 probe. This avoids having to open the unit to perform software updates :
- One pin for electric ground.
- One pin for the SWDIO signal
- One pin for the SWCLK signal
During the update, the chronocomparator must be powered (plugged into the mains and with the on/off switch in the on position).
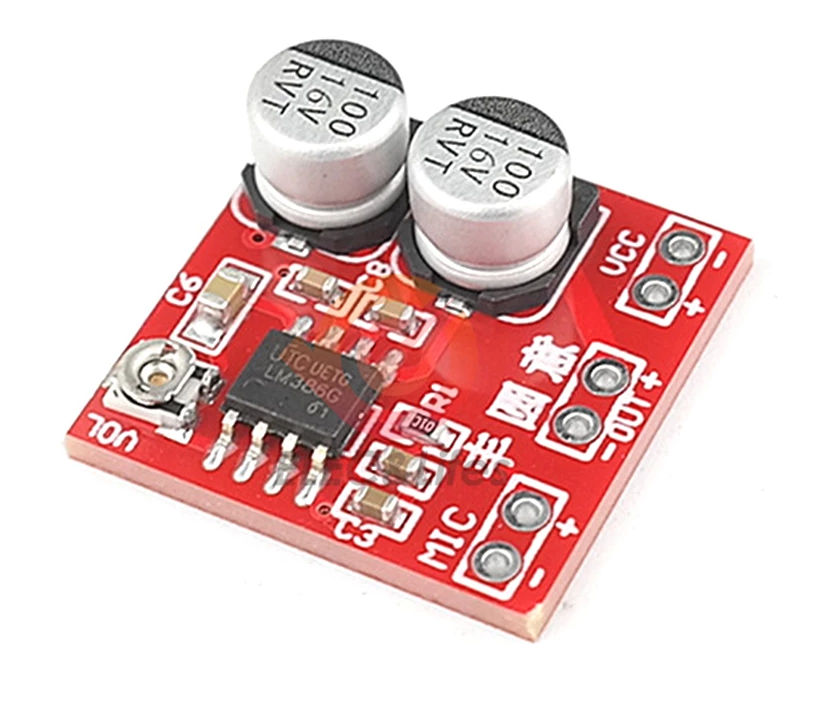
Audio-frequency speaker and amplifier
So I wanted to add a small speaker and an audio amplifier so I could hear the ticking sound of the watch being set, as well as a physical switch to mute or unmute the sound. This turned out to be less simple than I initially thought for two reasons :
- The first issue is that my case wasn't designed for this at all, and there wasn't much room for the addition. This forced me to perform some contortions to make everything fit. I could have made a new case, but printing takes quite a while, and I finally managed to fit everything in using a very thin speaker and a tiny amplifier based on the LM386.
- The other reason is more annoying. I was a bit too optimistic about my ability to fix an amplifier oscillation problem when subjected to an excessively high signal level. I got away with it by adding a dual concentric-axis volume control potentiometer: one to adjust the signal level for the chronocomparator (as shown in my schematic), and another for manually adjusting the sound volume. But this solution isn't very satisfactory (note: the dual potentiometer was added after the photos were taken).
After testing several amplification modules, I chose the one pictured below (€1 in 2026) but others are also perfectly suitable.
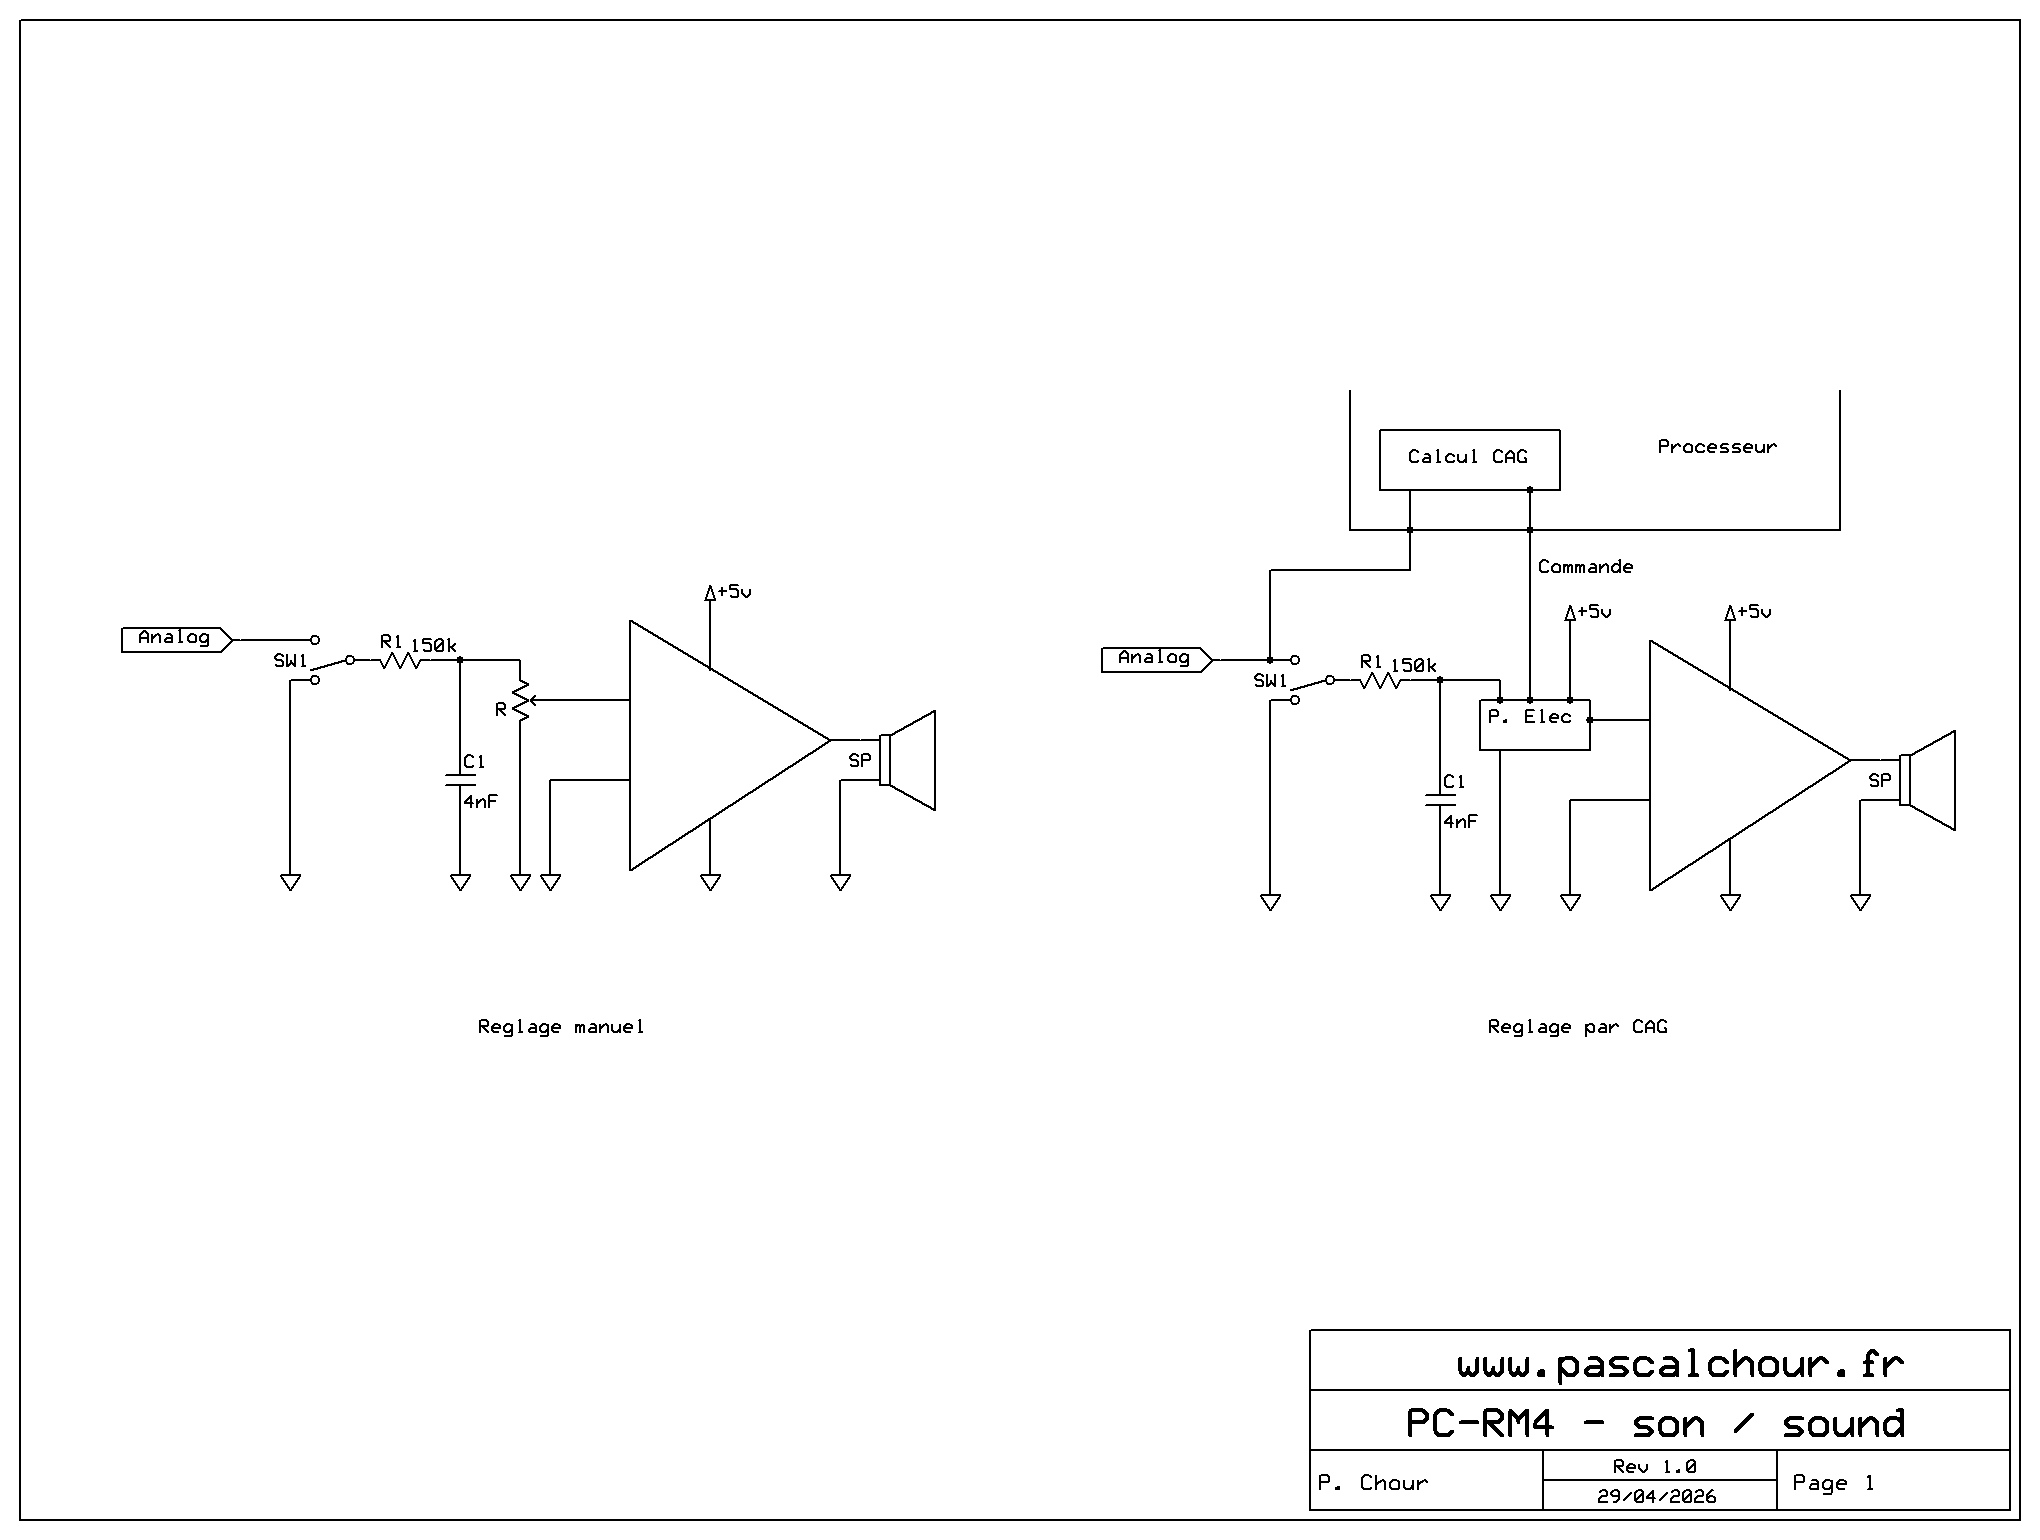
The solution I implemented is shown in the following diagram (manual adjustment).
Ideally, automatic gain control (AGC) would have been necessary to increase the signal level when it is very low and decrease it when it is high. I didn't have the space to implement such a circuit on the one I designed, hence the potentiometer-based solution. However, in a later version, this control could be implemented as follows:
- The amplifier is integrated onto the printed circuit board to avoid loose wires.
- Control of an electronic potentiometer by the processor: the processor receives the analog signal (for the "SCOPE" function), making it easy to attenuate the input signal to the amplifier by measuring the peak signal and reducing or increasing the volume accordingly. Obviously, a certain time constant is required to avoid constant volume fluctuations, and the sound must be muted if the level falls below a certain value (absence of signal beyond background noise).
A more elaborate scheme would therefore look like this (AGC adjustment):
ACCURACY AND PRECISION
The accuracy and precision of the device must be defined for the 3 measurements carried out:
- The duration of a beat (for example, 400ms for a watch that beats 18,000 times per hour).
- The difference between a Tick and a Tock.
- The advance-delay over a long period (for example, 24 hours).
The microcontroller board clock used has a resolution of 25ns. Its accuracy depends on that of quartz and is probably much less than 0.01%. We will call it P% thereafter. In this context, it can be said that:
- The accuracy of the difference between a Tick and a Tock is +/-25ns to within P%
- The duration of a beat is measured by summing the duration of the half-beats. The accuracy of this duration is therefore less, in absolute value, than 50 ns to within P%.
- The fact of going through hardware counters (32-bit counters of the microcontroller) makes it possible to guarantee that the measurement is not affected by the processing. This is also usually the case for versions with Arduino but there may be cases where interrupt priorities delay the clock read processing internal. In the present case, the counting (start/stop) and processing processes are almost independent.
To measure the advance/delay, the difference is taken between the sum of the durations of the Ticks and the Tocks measured and the expected duration. If NB is the number of measures of Tick and Tock, the difference with the expected duration is Deviation = sum (durations of Ticks and Tocks) - NB x duration of a period.
It is then sufficient to bring this value back to 24 hours to obtain the difference over 24 hours.
In the worst case, the measurement resolution accumulates in absolute value over the measurement period. If NB24 is the number of periods in 24 hours, then the lowest resolution bad is NB24* resolution. For a watch that beats at 18,000 beats per hour, this resolution is less than or equal to 18,000 x 24 x resolution of a measurement, i.e. approximately 21ms.
April 2019-September 2022
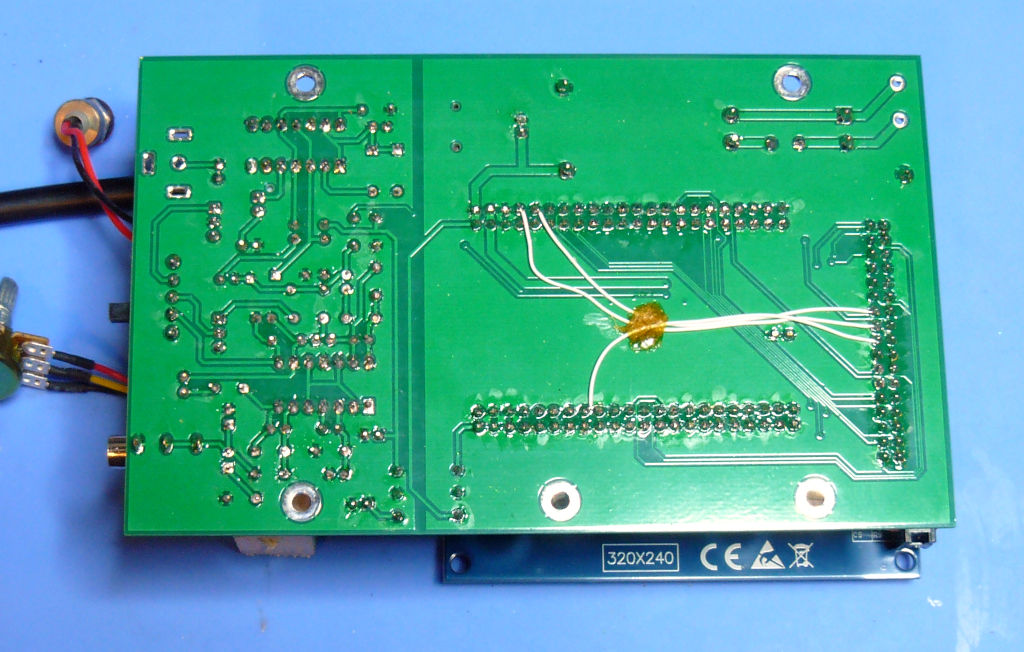
PROTOTYPES
The following photo is the back side of the printed circuit prototype. I had simply "forgotten" 3 tracks (naming error on the electronic diagram). PCB V1 corrects this point.
The following photo is a prototype using another development board than DevEBox. It was used for all the developments that are described on this page in French) for those who want to go into the detail of the realization. The screen is also different. In this case, it is a 480x320 screen with SPI bus. I also developed the 320x280 version, parallel bus which is the one I use.
The following photos show an example of the prototype casing.
Since then, I've modified the prototype to create a more refined version. I had a leftover printed circuit board which I used for all the power supply and analog measurement components. The STM32F407VET6 board, which has its own screen and battery, is connected to this circuit board for the power supplies (0V, 5V, 3.3V) and the four digital/analog signals for measurements. I also added a small amplifier module and a speaker to listen to the ticking sound.